

The Weekly Wrap
Over the last 7 days:
- Bitcoin (BTC) up 0.48%
- Ethereum (ETH) down 1.52%
- XRP down 3.49%
- Solana (SOL) down 2.11%
Other movers:
The crypto market cooled slightly this week, with the total market cap falling 1.01% to $2.56T as traders continue to navigate macro uncertainty and geopolitical headlines.
Despite the pullback, ETF demand remained strong.
Bitcoin ETFs recorded $823.70M in inflows, while Ethereum ETFs added $155.01M, marking three straight weeks of positive flows for both. The chart below shows how ETF demand has started building again after the heavy outflows seen earlier in the year, with BTC also recovering steadily from the February lows.
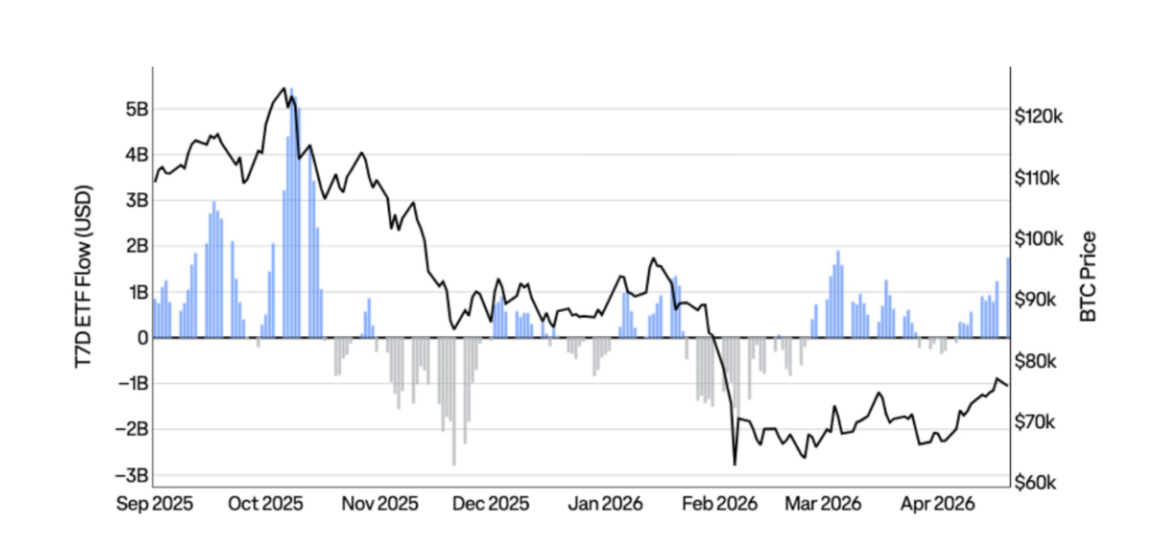
Sentiment is still cautious overall, with the Fear & Greed Index sitting at 33 (Fear), although this is a noticeable improvement from the extreme fear levels seen earlier this month.
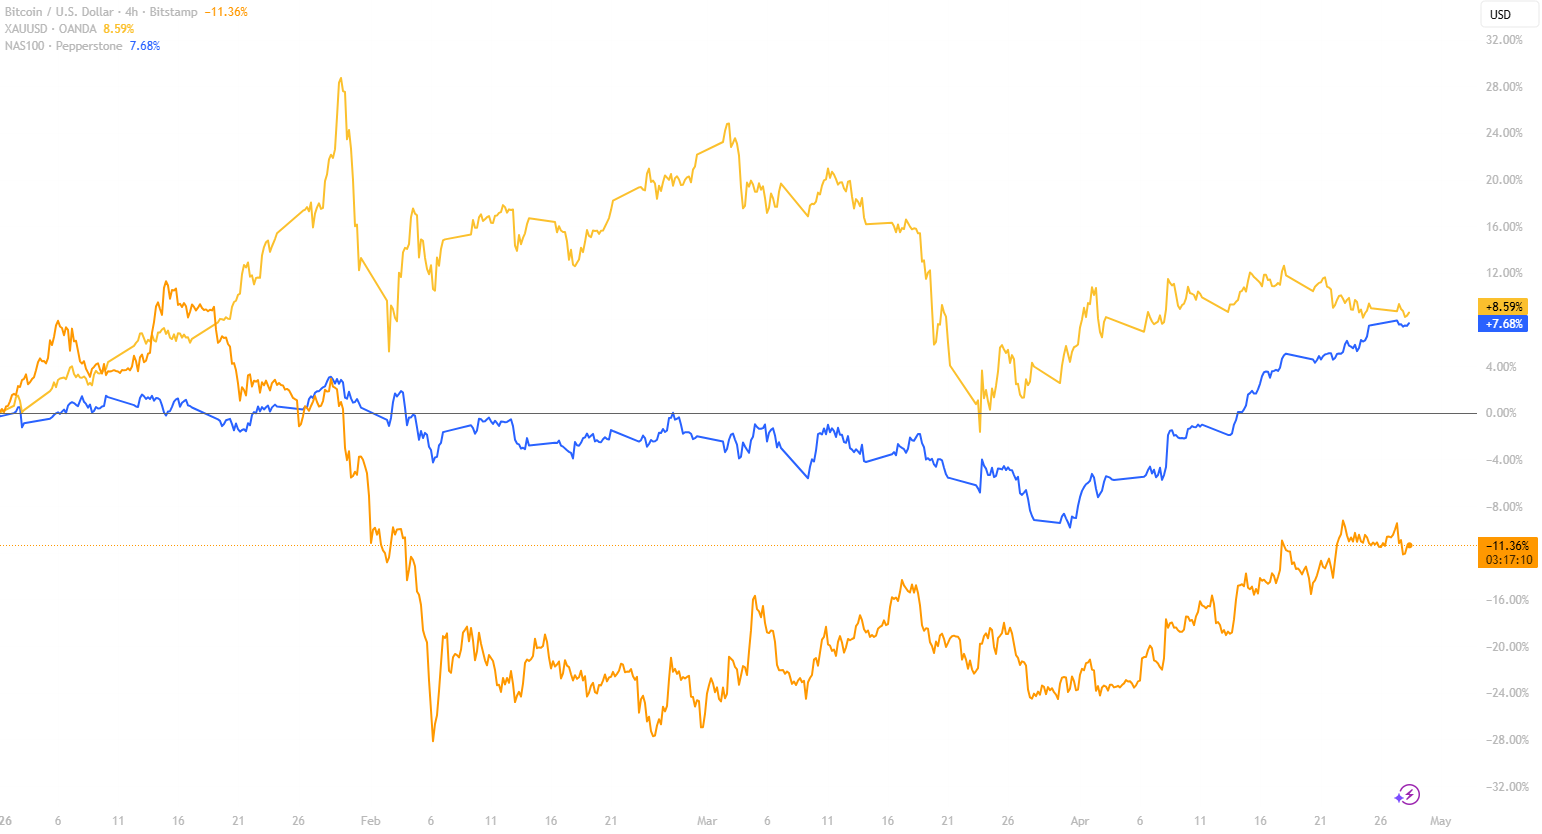
Bitcoin vs Gold vs Nasdaq YTD.
🟡 Gold: +8.59%
🔵 NASDAQ: +7.68%
🟠 Bitcoin: -11.36%
Gold remains one of the strongest performers on the year, although momentum has cooled after the sharp rally seen during the peak of geopolitical tensions earlier in the quarter.
The bigger story recently has been the NASDAQ. After falling as much as 8% on the year during the broader market sell-off, US equities have staged a strong recovery and are now nearly back in line with gold’s 2026 performance.
Bitcoin has also recovered from the lows, climbing steadily over recent weeks, but continues to lag behind traditional markets on a year-to-date basis. The move does, however show risk appetite slowly returning after one of the more volatile starts to a year in recent memory.
Source: Tradingview, BTC, GOLD, NASDAQ
Macro
The market is increasingly pricing in another RBA rate hike at the upcoming May 5 meeting.
The latest RBA rate tracker now shows roughly a 74% probability of a 25bps increase to 4.35%, up from around 60% earlier this month. Sticky inflation, elevated energy prices, and ongoing geopolitical uncertainty continue to keep pressure on the central bank.
![]()
Source: RBA Rate Tracker
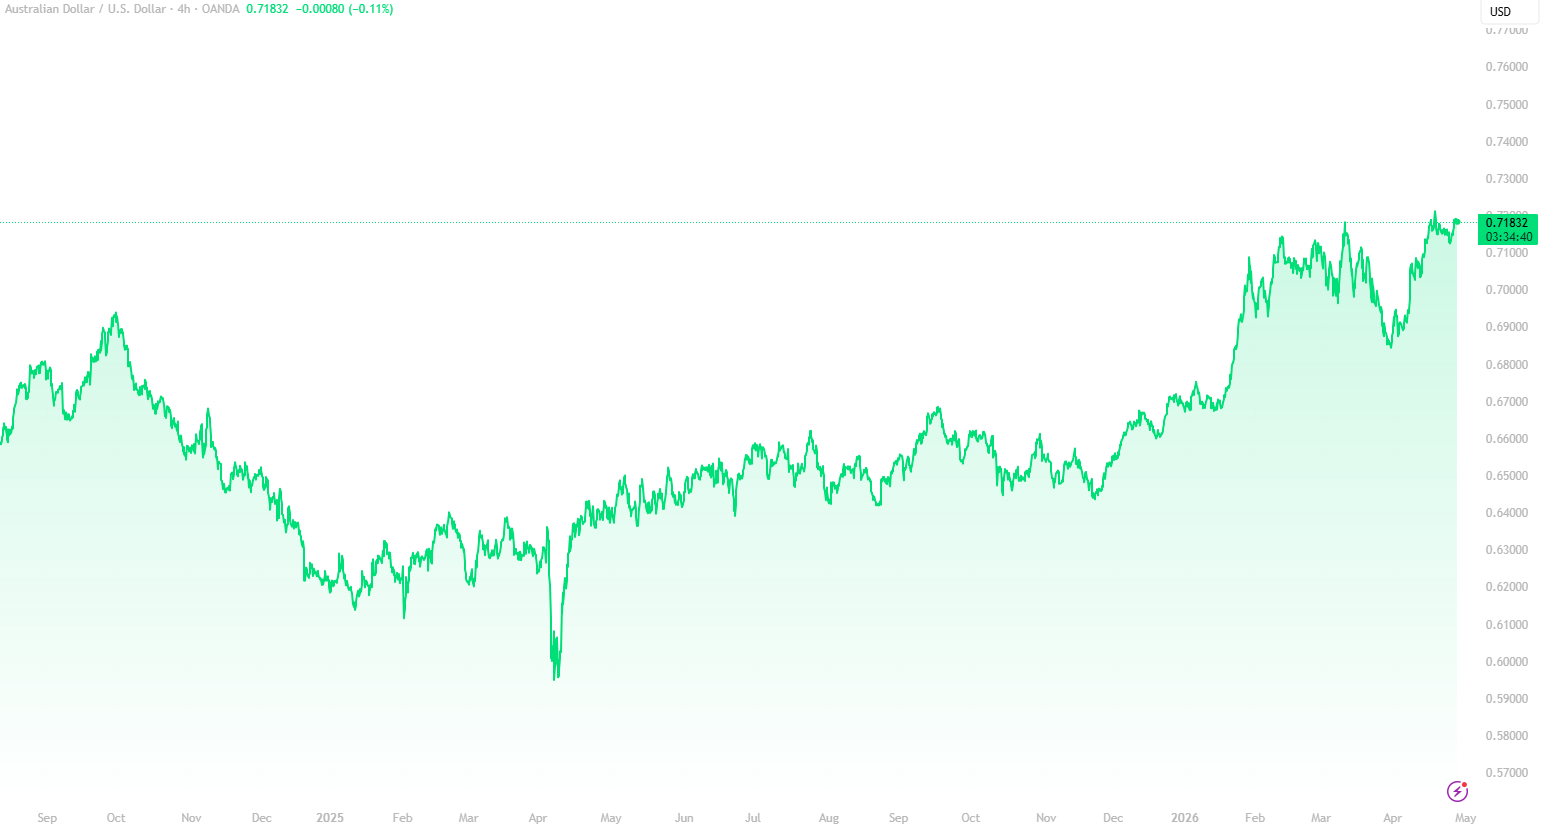
At the same time, the Australian Dollar has been quietly strengthening.
AUD/USD has been in a clear uptrend since early 2025, now trading around 0.718 USD, its strongest levels in years. The move reflects improving sentiment toward the Australian economy, stronger commodity pricing, and expectations that Australian interest rates could remain higher for longer relative to other developed markets.
Source: Tradingview AUD/USD
Bitcoin
Bitcoin liquidation maps continue to show a larger concentration of liquidity sitting above current price, particularly around the $78K–$80K region.
These areas contain heavily leveraged short positions that could be forced to close if BTC pushes higher, potentially creating a short squeeze and accelerating volatility upward.
There is still liquidation liquidity below current price as well, but the current liquidation structure shows more liquidity sitting above current price levels. As BTC continues consolidating, traders will be watching closely to see which side of the liquidity gets targeted next.

Source: coinglass
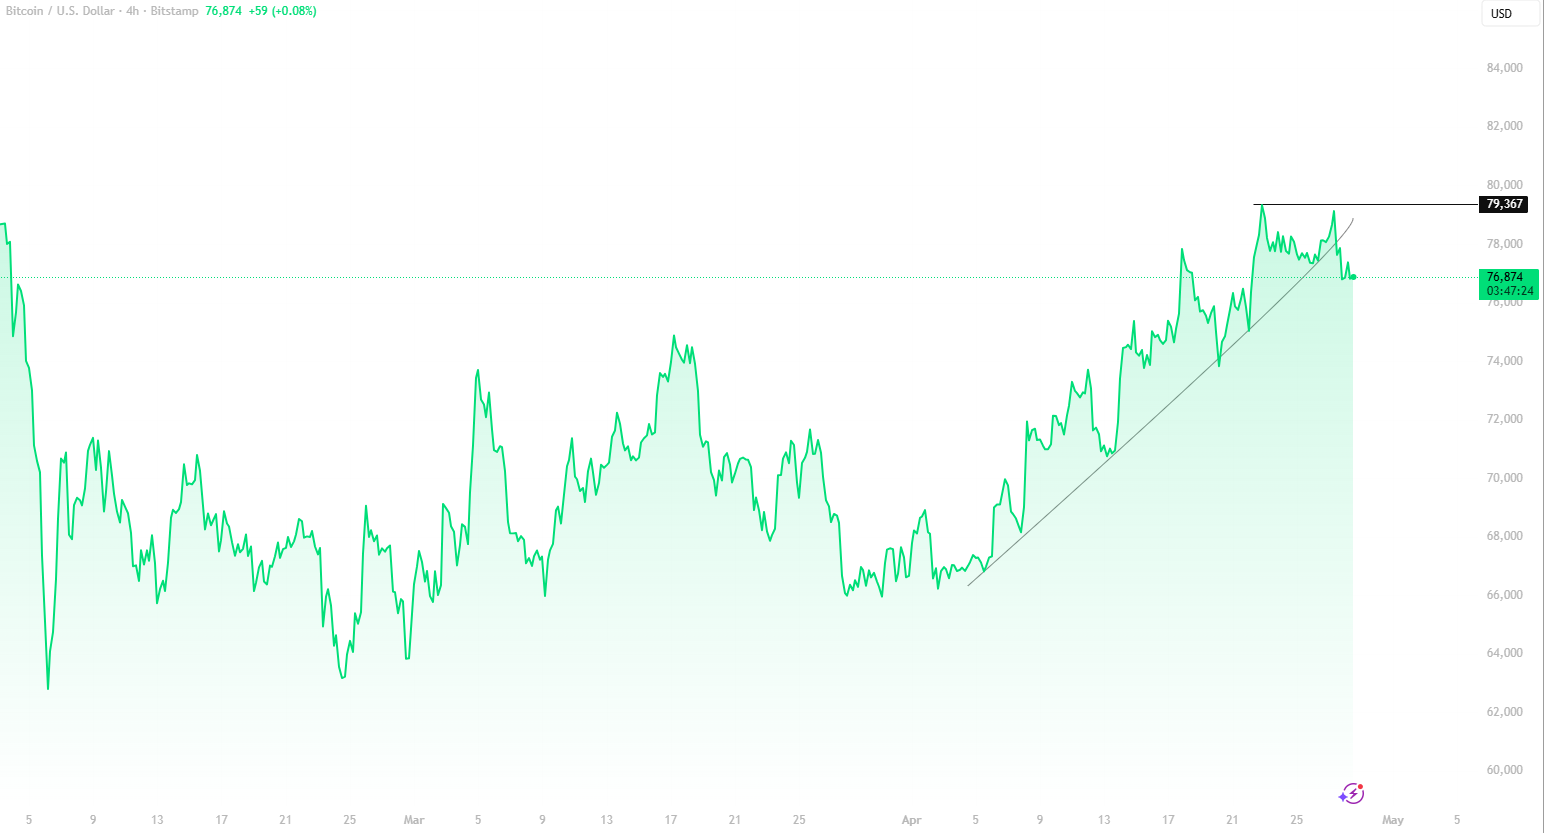
Bitcoin has rallied strongly since the beginning of April, climbing back toward the upper end of the current range near $79K.
Momentum has cooled slightly over the past few days, with BTC recently breaking below the short-term rising trend line that had supported the move higher throughout the month.
For now, price is still holding above key local support, but traders will be watching closely to see whether this is simply a cooldown before trend continuation, or the beginning of a deeper retrace after the recent run-up.
Source: Tradingview BTC/USD
Etherum
Ethereum has been consolidating near local highs and is currently forming a wedge pattern.
A wedge forms when price action begins tightening between rising support and falling resistance lines, creating a compression zone. In simple terms, buyers and sellers are gradually squeezing price into a smaller range as momentum slows.
Here are some wedge pattern scenarios to help understand price action in crypto.
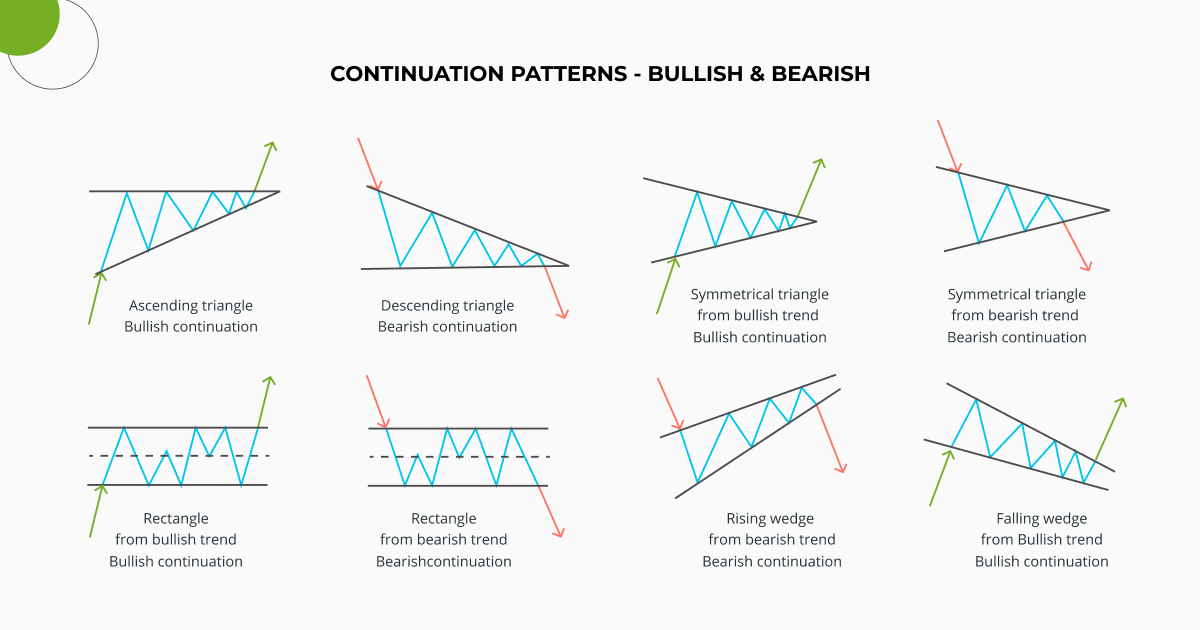
In ETH’s case, the higher lows suggest buyers are still stepping in, while the lower highs show sellers continuing to defend the $2.4K region.
This type of structure usually leads to a stronger move once price finally breaks out of the pattern. A break above resistance could open the door for continuation higher, while a breakdown below support may signal a short-term retrace after ETH’s recent recovery rally.
The key thing traders watch with wedges is volume and confirmation. False breakouts are common until momentum clearly shifts in one direction.
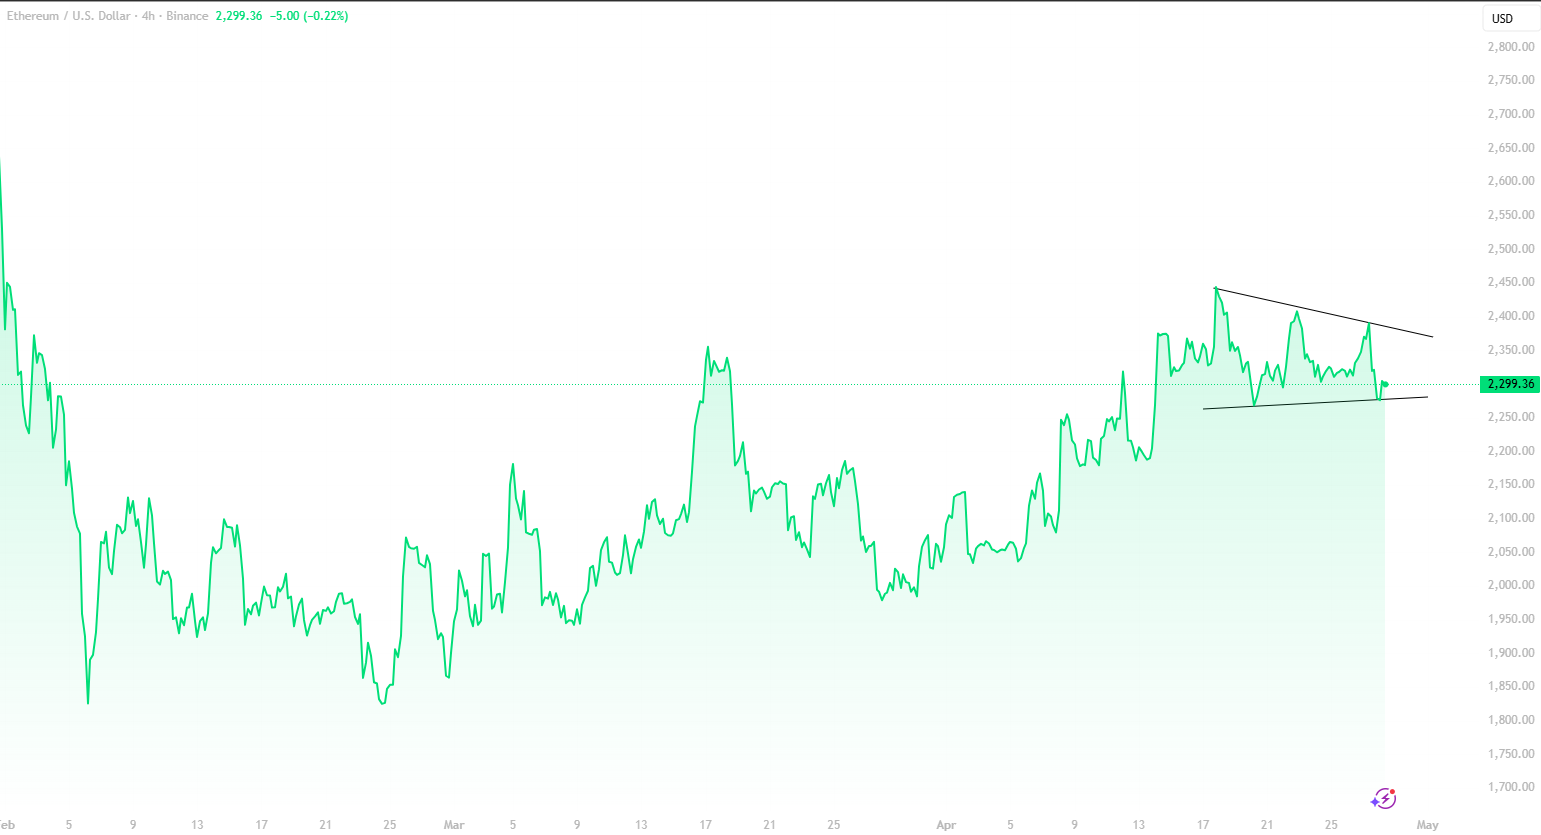
Source: Tradingview ETH/USDT
Altcoins
This week’s strongest sector was Gaming, up 2.97% over the past 7 days, followed closely by DeFi at +2.70%. AI tokens also stayed positive at +0.93%, while RWA projects cooled slightly, falling 0.53% after several strong weeks of outperformance.
Memecoins continued to struggle, down 1.91% on the week as traders rotated back toward higher utility sectors and larger cap assets.
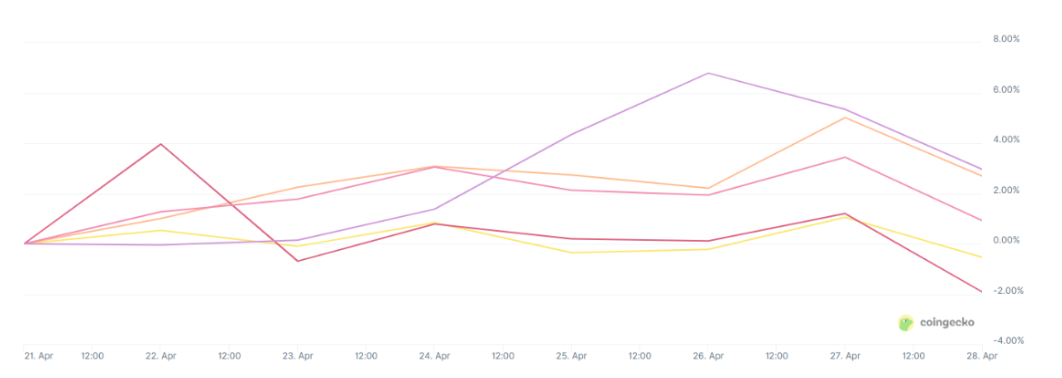
Source: Coingecko categories
The Altseason Index is currently sitting around 42, keeping the market firmly in the middle ground between Bitcoin Season and Altcoin Season
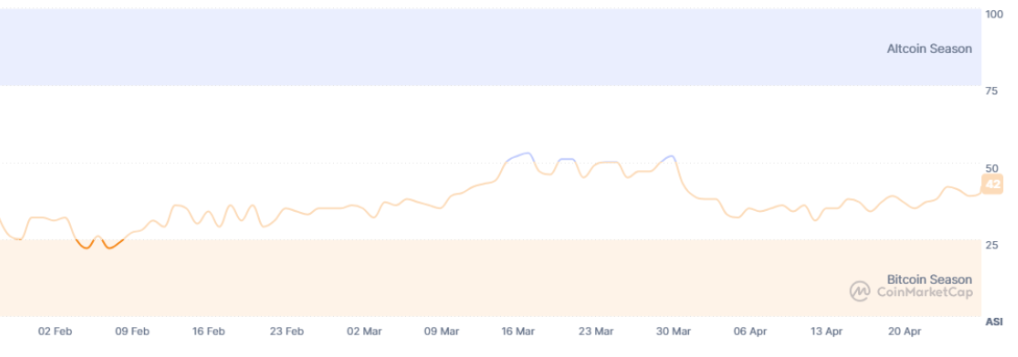
Source: Altseason Index Coinmarketcap
SOL
This week, the Solana Foundation introduced a new security initiative called STRIDE, developed with Asymmetric Research to improve audits, threat detection, and exploit prevention across the ecosystem.
Solana developers are also preparing for the longer-term risk of quantum computing. Two core validator teams, Anza and Firedancer, independently selected the same post-quantum cryptography solution called Falcon, with working implementations already published on GitHub.
Meanwhile, Solana’s next major upgrade, Alpenglow, aims to reduce transaction finality times to roughly 100–150 milliseconds. If successful, the upgrade could significantly improve network speed and strengthen Solana’s position in payments, trading, and consumer applications.
On the chart SOL has been grinding sideways in a tight range since early February, with price continuing to consolidate after the sharp sell-off earlier in the year.
Right now, the market still looks indecisive. Bulls have managed to hold support repeatedly around the lower end of the range, but SOL continues struggling to break higher with conviction.
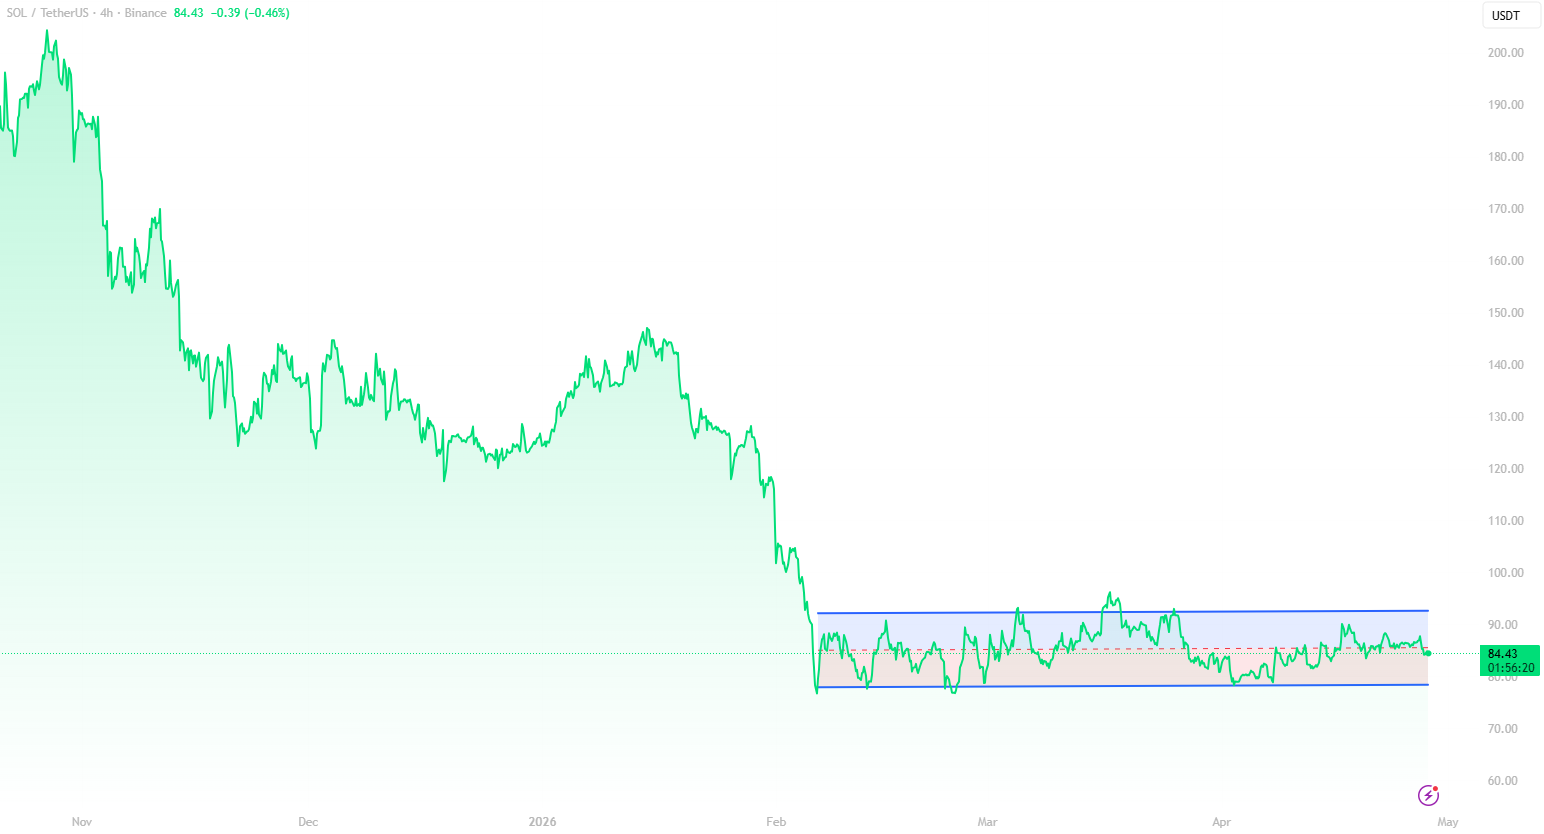
Source: Tradingview SOL/USD
This Week's Insights
This week’s insight looks at what many traders call the “boring phase” of crypto, the quieter periods where price action slows, volatility fades, and attention disappears from the market.
Rather than focusing on hype, the article explores how these phases can be used to reassess portfolios, compare relative strength against Bitcoin, and better understand token supply mechanics such as emissions, unlocks, and circulating supply growth.
It also breaks down why many assets never reclaim previous cycle highs, and why quieter markets can often be the best time to improve long-term decision making and market understanding.
Read the full article here: The "Boring Phase" Playbook Part 1


