

The Weekly Wrap
Over the last 7 days:
- Bitcoin (BTC) up 1.59%
- Ethereum (ETH) down 0.40%
- XRP up 4.37%
- Solana (SOL) up 1.92%
Other movers:
The total cryptocurrency market cap stands at approximately $2.52 trillion which is up 1.52% over 7 days. Bitcoin dominance is back above 60% and still trapped in a range. Stablecoins represent $302 billion, accounting for a 12% share of total crypto market cap. Institutional demand picked up last week.
Bitcoin ETFs recorded $996.38 million in weekly net inflows for the week ending April 17, 2026, marking their third consecutive week of positive flows, according to SoSoValue data. April 17 produced the largest single-day contribution at $663.91 million.
Ethereum ETFs recorded $275.83 million in weekly net inflows for the week ending April 17, 2026 their strongest weekly total in recent periods. April 17 produced $127.49M the largest single-day ETH ETF inflow of the week.
Bitcoin vs Gold vs Nasdaq YTD.
🟡 Gold: +11.88%
🔵 NASDAQ: +5.11%
🟠 Bitcoin: -14.50%
Gold remains the standout, holding strong as a traditional safe haven despite recent volatility. It pulled back sharply but has recovered and is still leading on the year. The NASDAQ has quietly stabilised after a weak start, now pushing back into positive territory as equities find some footing.
Bitcoin, however, is still lagging. While price has bounced from the lows, it remains down on the year, continuing to trade more like a risk asset than a hedge in the current environment. Overall, capital is still favouring traditional markets, with crypto yet to fully reclaim momentum.
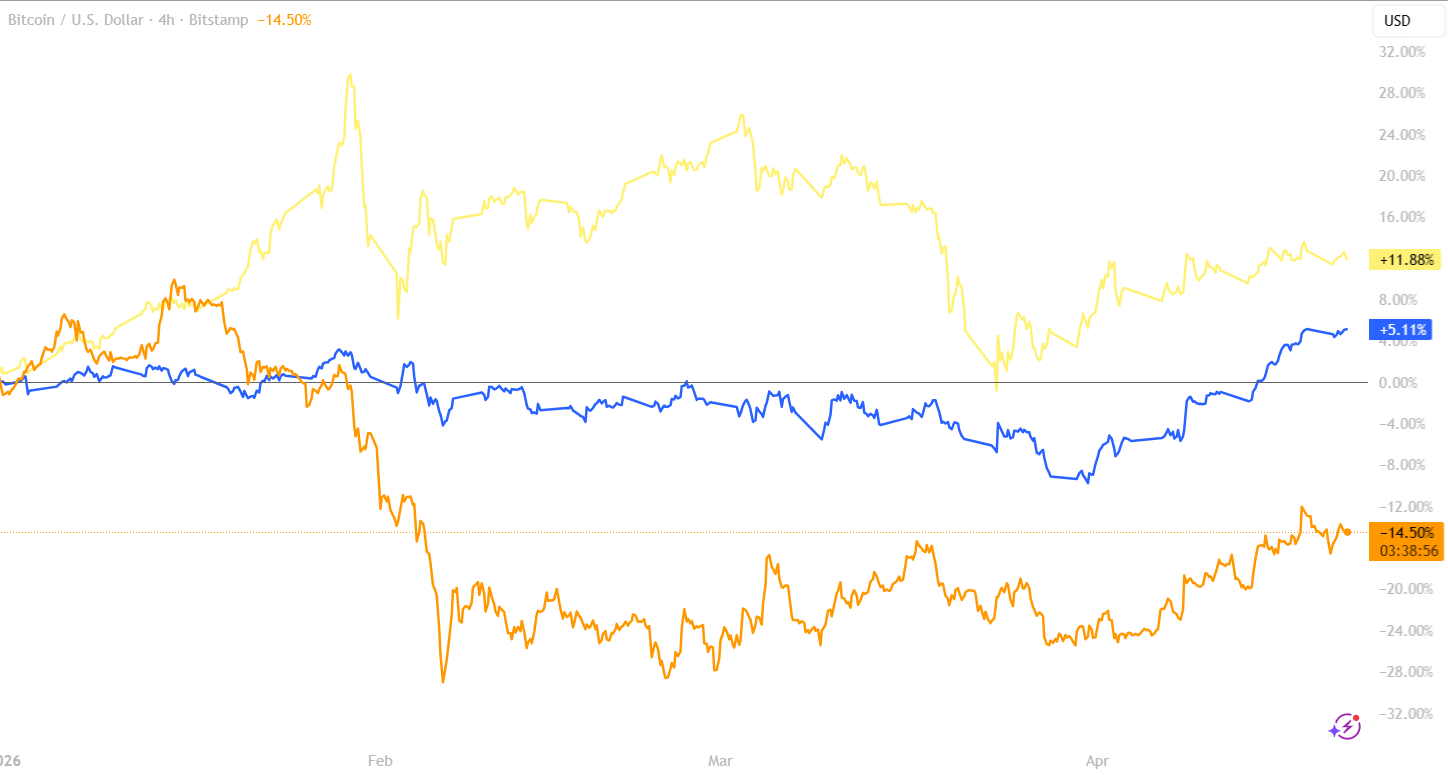
Source: Tradingview, BTC, GOLD, NASDAQ
Macro
Macro is still being driven by energy, debt, and a market that looks increasingly comfortable ignoring both. Brent crude rose to $95.42/barrel, up 5.58% on April 20,after Iran reversed plans to reopen the Strait of Hormuz following a reported US-related incident involving a cargo ship that was seen as violating the ceasefire. That keeps supply risk elevated and inflation back in focus.
At the same time, US equities pushed higher. The S&P 500 hit a fresh all-time high at 7146, while the Nasdaq also set a new record high at 26,735 as investors largely looked through the Iran conflict and kept bidding risk assets higher.
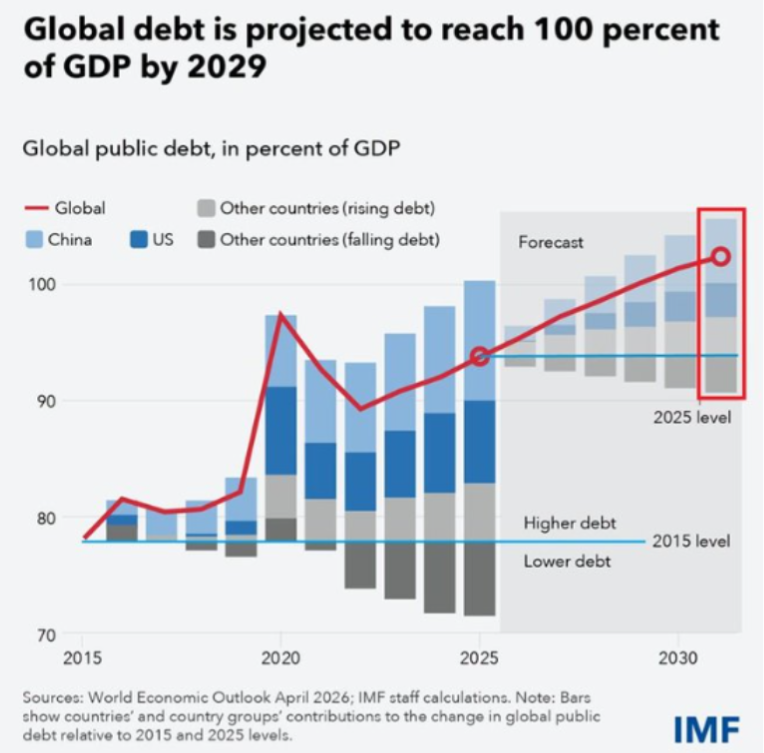
Then there’s the bigger backdrop: debt. The IMF now expects global government debt to reach 102% of GDP by 2030, a level not seen since World War II, with the US and China driving much of the increase. The chart shows the direction clearly: public debt is still rising, and structurally higher debt levels are becoming part of the macro landscape rather than a temporary issue.
Bitcoin
Lets dive into some BTC charts.
1. MVRV is sitting low
That tells us most holders are not sitting on large profits. We’re no longer in that overheated zone (3+) where everyone is rushing to sell.
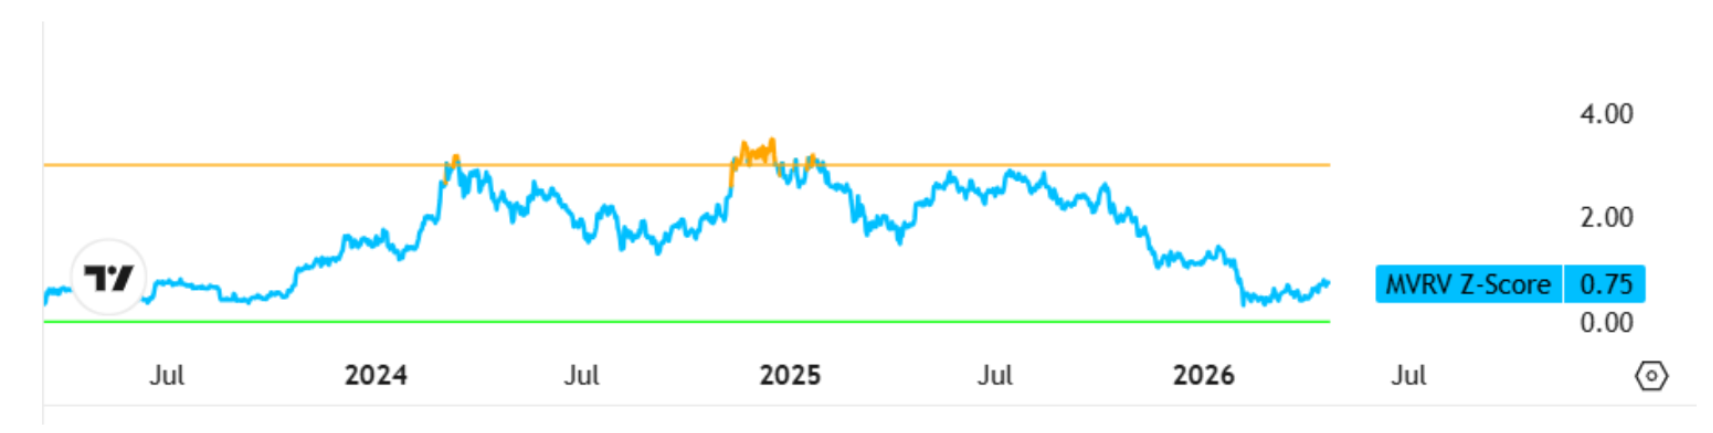
Source: capriole.com
2. Exchange reserves are at all-time lows
BTC continues to leave exchanges, meaning less supply is available to trade.
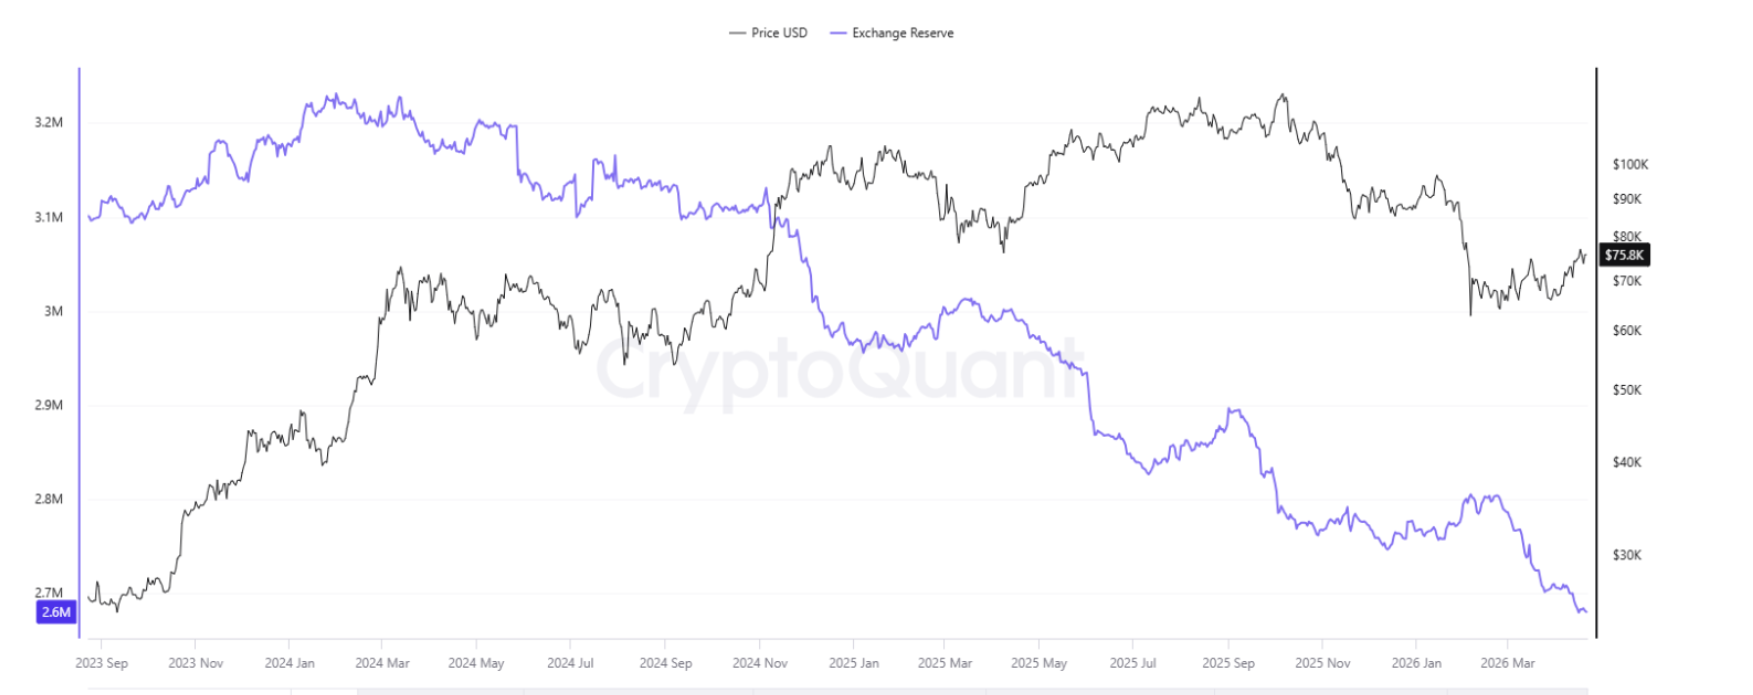
Source: CryptoQuant
Put those together:
- Low MVRV = less incentive to sell
- Low exchange supply = less BTC available if buyers step in
This is a tight supply + low profit pressure environment. If demand increases, it would interact with a market where available supply is relatively constrained.
Etherum
Ethereum just posted its busiest quarter ever, with over 200 million transactions in Q1. That’s more than double the 2023 lows and a clear sign activity is back.
At the same time, capital is still flowing in. One example: Bitmine added over 100K ETH ($230M) in a single week, pushing total holdings close to 5 million ETH.
The Kelp DAO Shock
A $290M+ exploit hit Kelp DAO’s LayerZero bridge, sending shockwaves across DeFi.
Attackers used the stolen rsETH as collateral on Aave, which:
- Pushed utilisation to 100%
- Forced market freezes
- Triggered a $6.2B withdrawal wave
ETH itself dipped as liquidity stress spread across the ecosystem.
Looking at ETH, price has been grinding higher since early February, slowly building momentum rather than moving aggressively.
We’ve now pushed back into the $2,300–$2,350 range, which has acted as resistance in recent months. A break above this level may signal a shift in market structure, while rejection could see continued range-bound behaviour.
This week should give us clarity on which direction comes next.
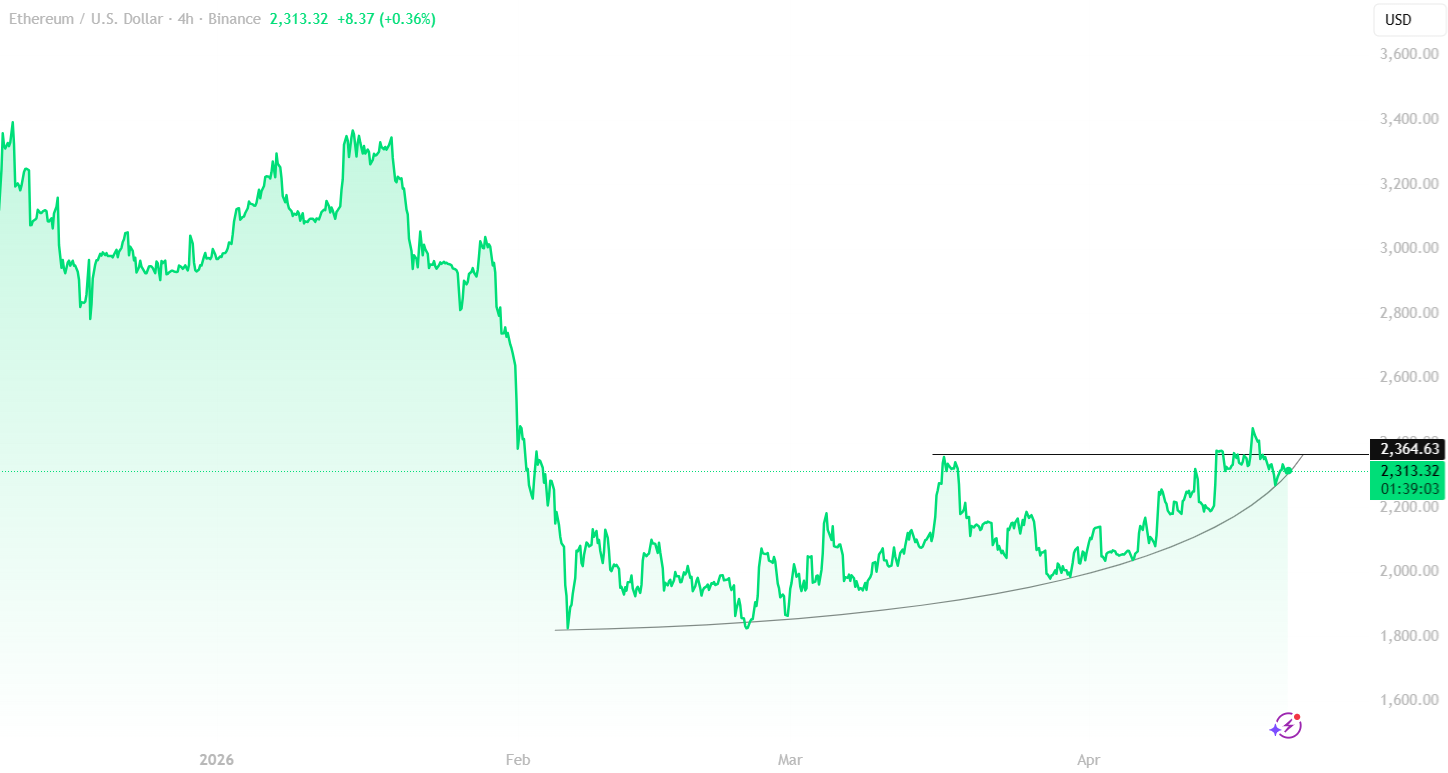
Source: Tradingview ETH/USDT
Altcoins
Altcoins had a mixed week, but a few trends are starting to stand out.
Real World Assets (RWA) led the way, up +5.94%, continuing to show relative strength even while the broader market chops sideways. Memecoins followed, up +4.94%, proving there’s still selective risk appetite in the market.
On the downside:
- DeFi slipped -2.12%
- AI cooled off -1.68%
- Gaming edged lower -0.74%
The chart shows a mid-week push across most categories, followed by a fade into the weekend. Not a breakout, more of a rotation.
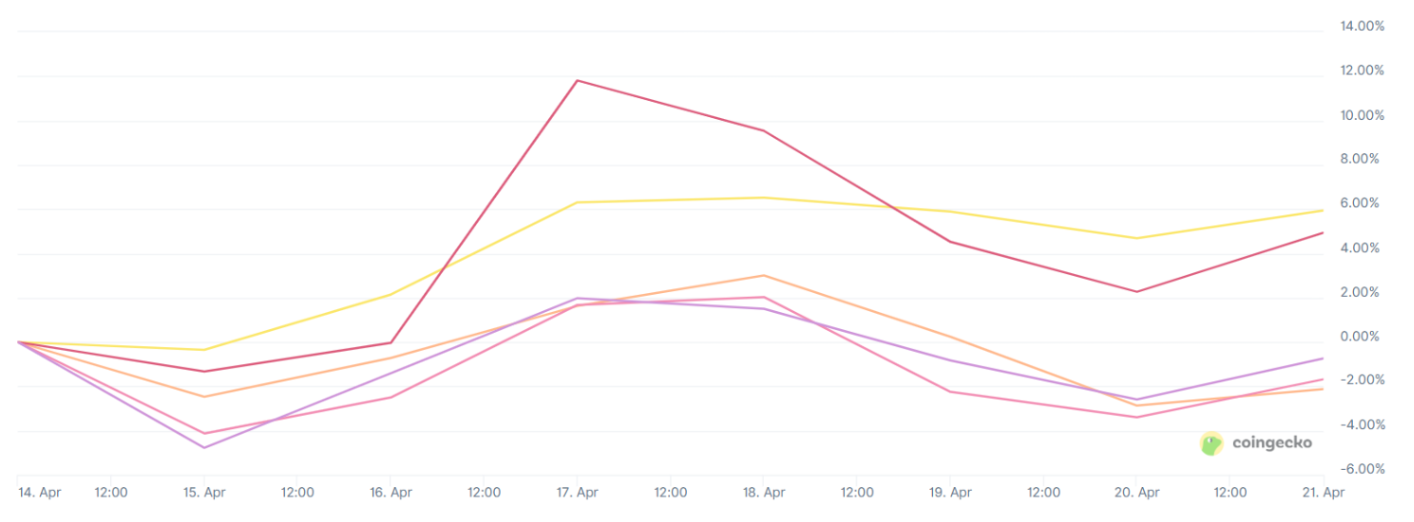
Source: Coingecko categories
The Altcoin Season Index sits at 39, sitting closer to BTC territory.
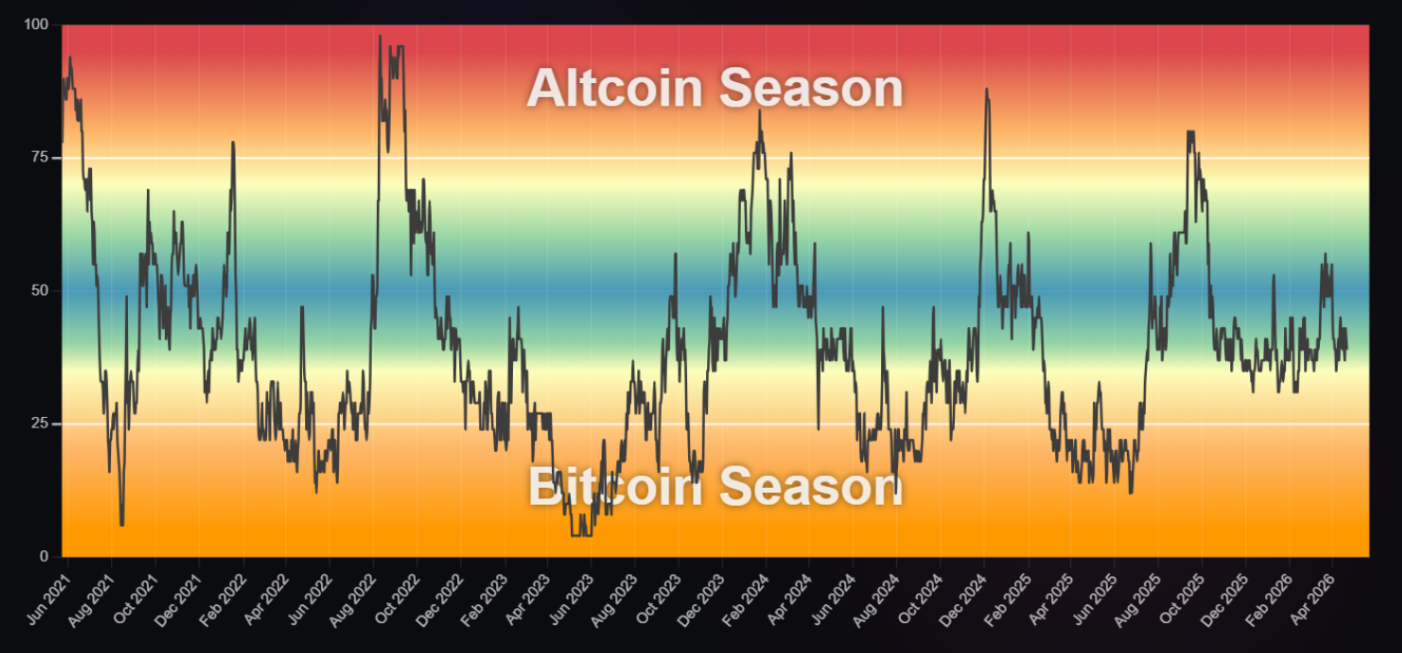
Source: Altseason Index blockchaincentre.net
Tokenised Assets
One of the more interesting trends this week isn’t DeFi or AI… it’s Pokémon cards.
Weekly revenue across Pokémon TCG marketplaces just hit $5.38M, sitting just below all-time highs. But the important part isn’t the number, it’s the structure.
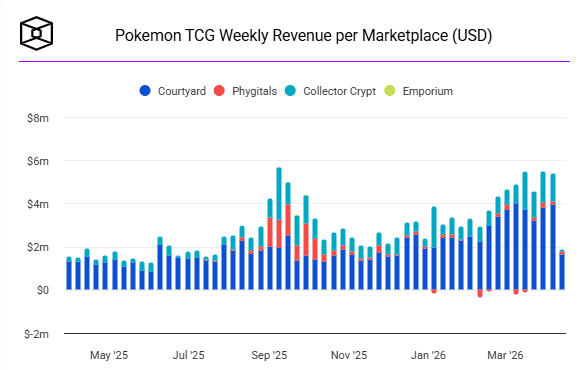
Last cycle, activity was driven by one-off hype. This time, it’s been consistent for multiple weeks, with platforms like Courtyard doing most of the heavy lifting. So what’s different?
Platforms like courtyard.io take physical cards, store them securely, and issue an NFT that represents ownership. You can trade it instantly, or redeem it for the real card. These are technically NFTs, but not in the way most people think. Instead of being the asset itself, the NFT acts as a digital wrapper for a real-world item.
You can think of it similarly to something like tokenised gold (e.g. PAXG), where a physical asset is held in custody and a digital token represents ownership. The difference is that collectibles are non-fungible, meaning each token represents a unique item rather than a standardised asset.
These assets are traded using crypto rails, typically:
- ETH as the base layer
- Stablecoins like USDC for settlement
- In some cases, fiat onramps for accessibility
So while the asset is physical, the trading and liquidity all happen on-chain. This is what real-world asset tokenisation actually looks like. Just… people trading Pokémon cards using crypto rails.
If this model holds, it doesn’t stop at cards. It extends to sports memorabilia, watches, and other collectibles. It’s a small niche today, but one of the clearest examples of crypto being used as financial infrastructure, not just an asset class.
This Week's Insights
This week we are looking at The Great Wealth Transfer and why it may be quietly bullish for digital assets.
The key idea is simple. It’s not just that trillions are changing hands, it’s that this is happening at the same time finance is becoming more digital, more tokenised, and increasingly 24/7.
It points to a longer-term shift toward digital financial rails, where stablecoins, tokenised assets, and on-chain infrastructure play a much bigger role.
Read the full article here: The Great Wealth Transfer is Real


