The Weekly Wrap
Crypto markets cooled their heels this week. Total market cap slipped 0.38% to $2.21T, relatively flat after last week's bounce off the yearly low.
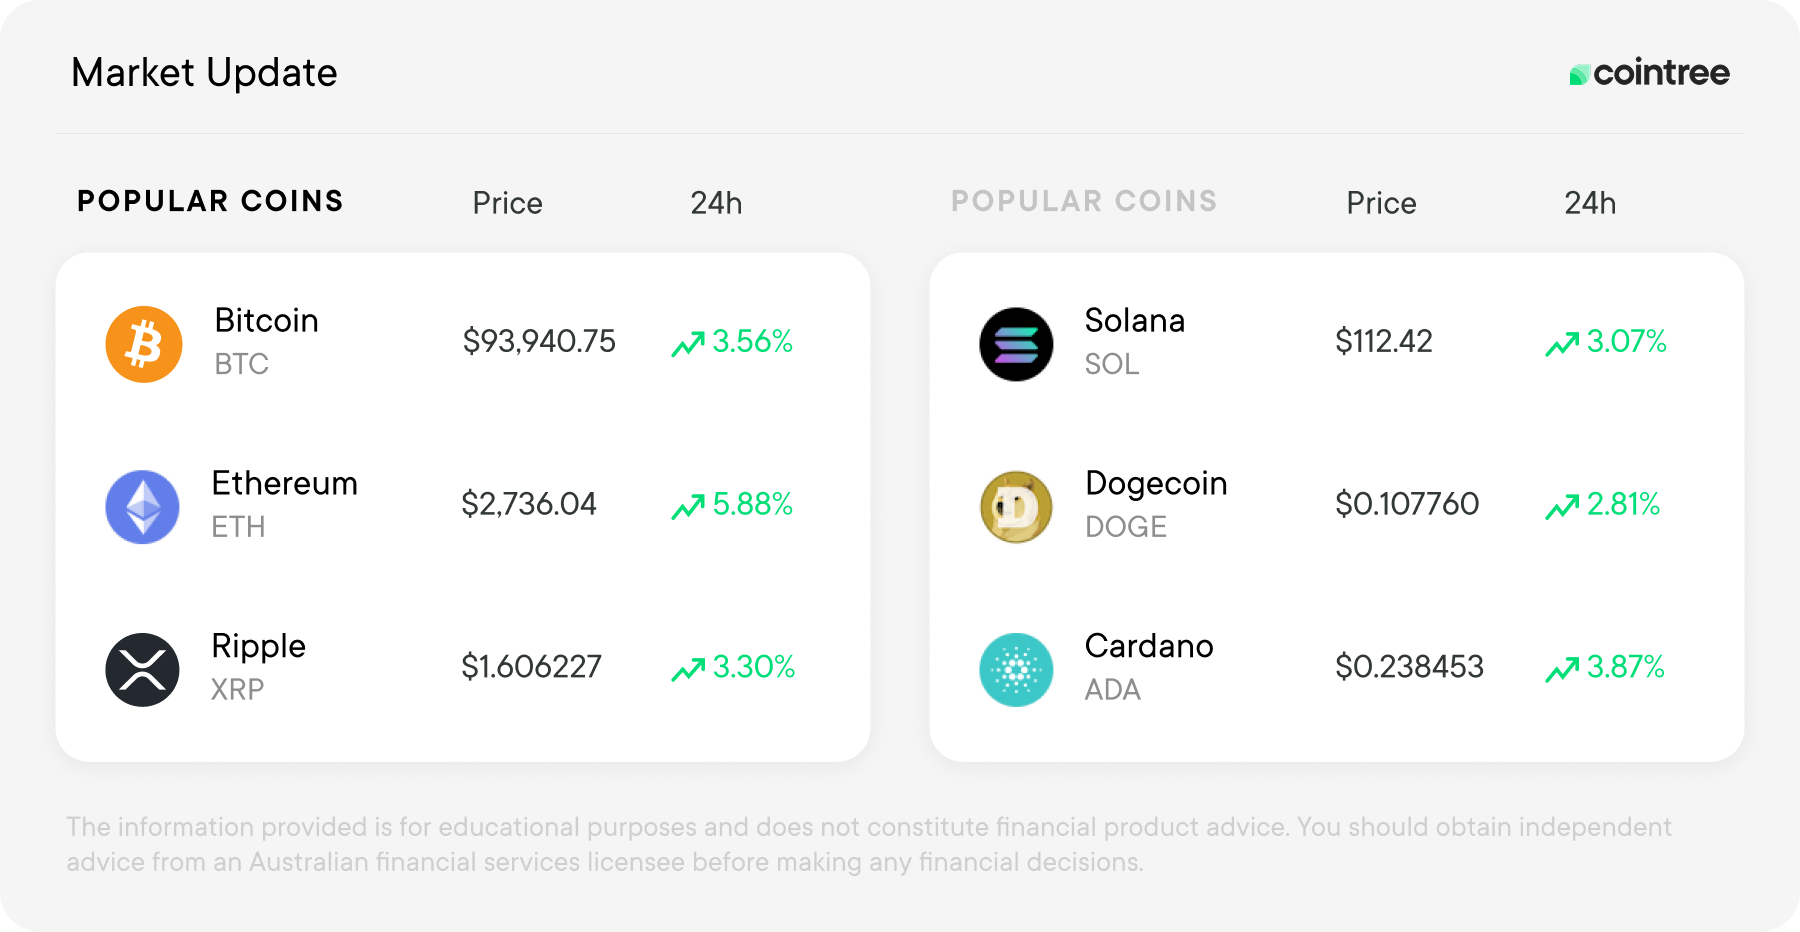
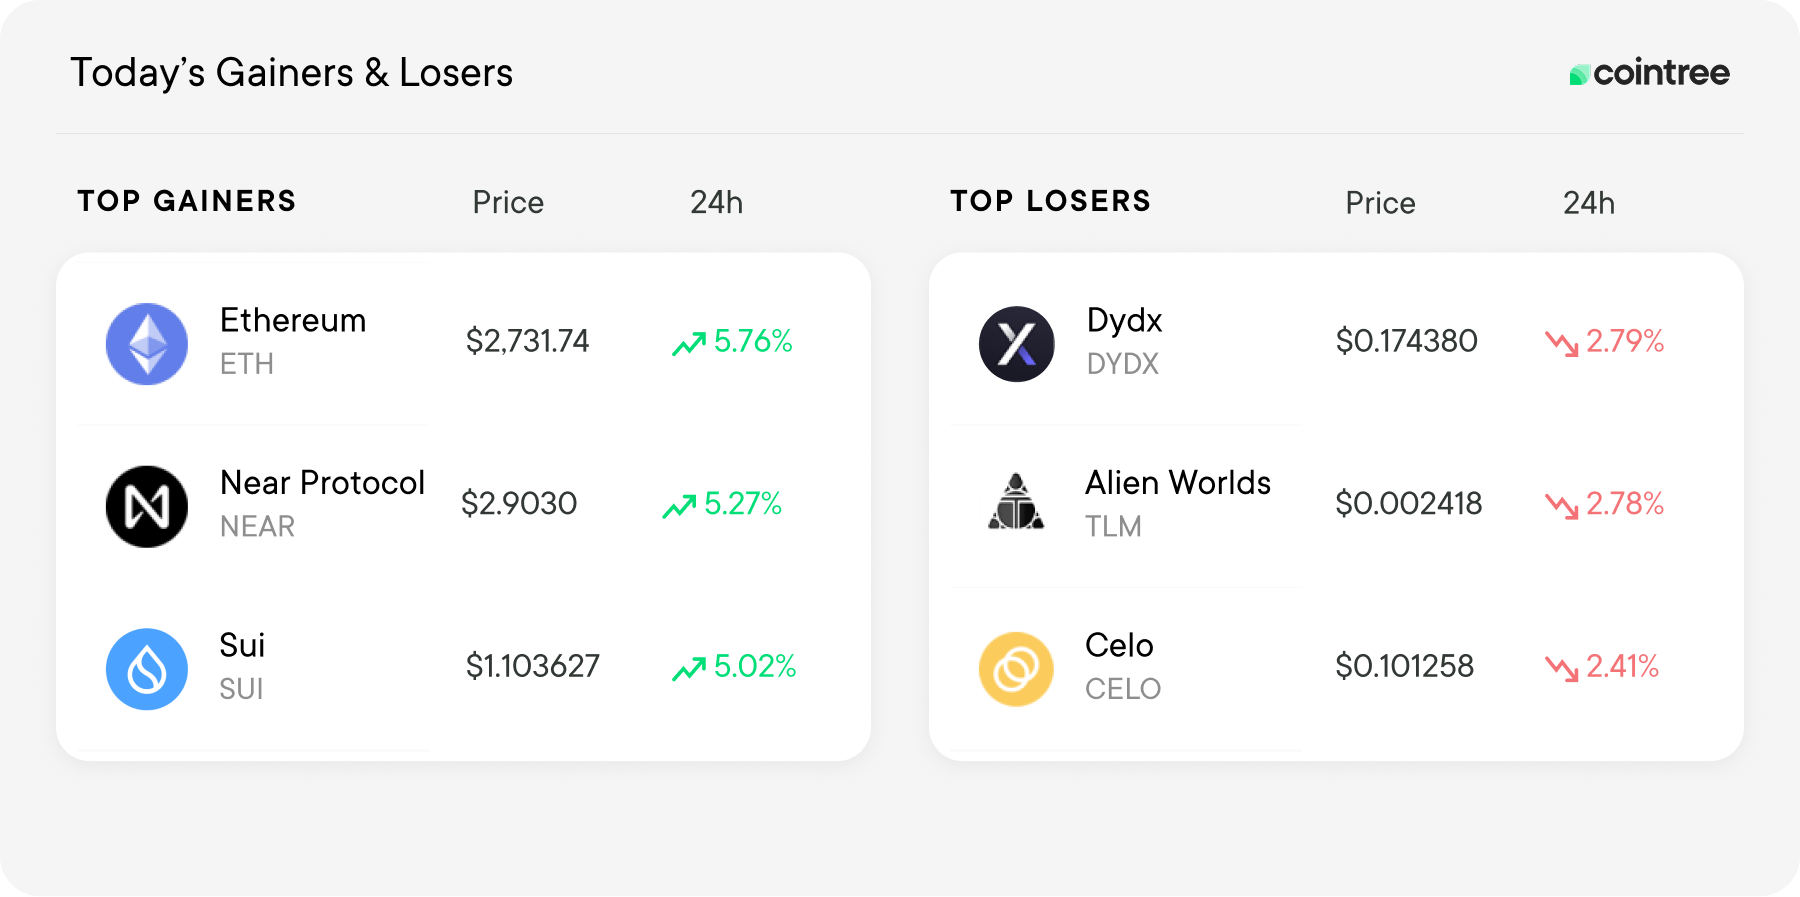
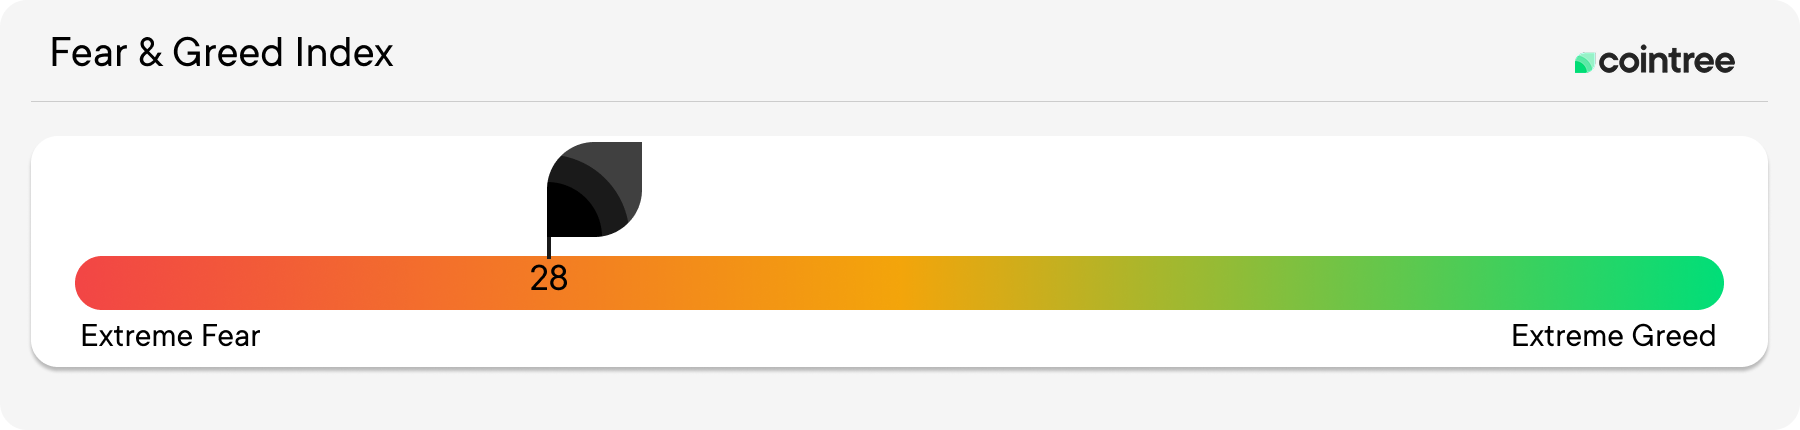
The Fear and Greed Index sits at 28, barely moved and still firmly in fear territory.
ETF flows turned positive but stayed muted: BTC saw inflows of $197.40m and ETH $84.42m, minimal numbers in these market conditions.
Macro: Oil spikes as Hormuz tensions escalate
The big story this week sits outside crypto. Brent crude jumped almost 11% to $83.31, one of its sharpest daily moves since the US-Iran conflict began, after President Trump reinstated a blockade on vessels entering or leaving Iranian ports and proposed a 20% charge on cargo passing through the Strait of Hormuz. US forces struck hundreds of targets in Iran over the weekend, and Tehran has again declared the strait closed.
The supply squeeze is already showing up in shipping data. Only nine vessels crossed the strait in a 12-hour window on Sunday, down from around 130 daily crossings before the conflict. The strait normally carries roughly one-fifth of global oil trade, so markets are repricing risk quickly, with Japanese equities alone shedding 82 trillion yen over three weeks. The $90-$92 zone is the next level oil watchers are eyeing, and a sustained geopolitical risk premium in energy is the kind of macro pressure that tends to keep risk assets, crypto included, on the defensive.
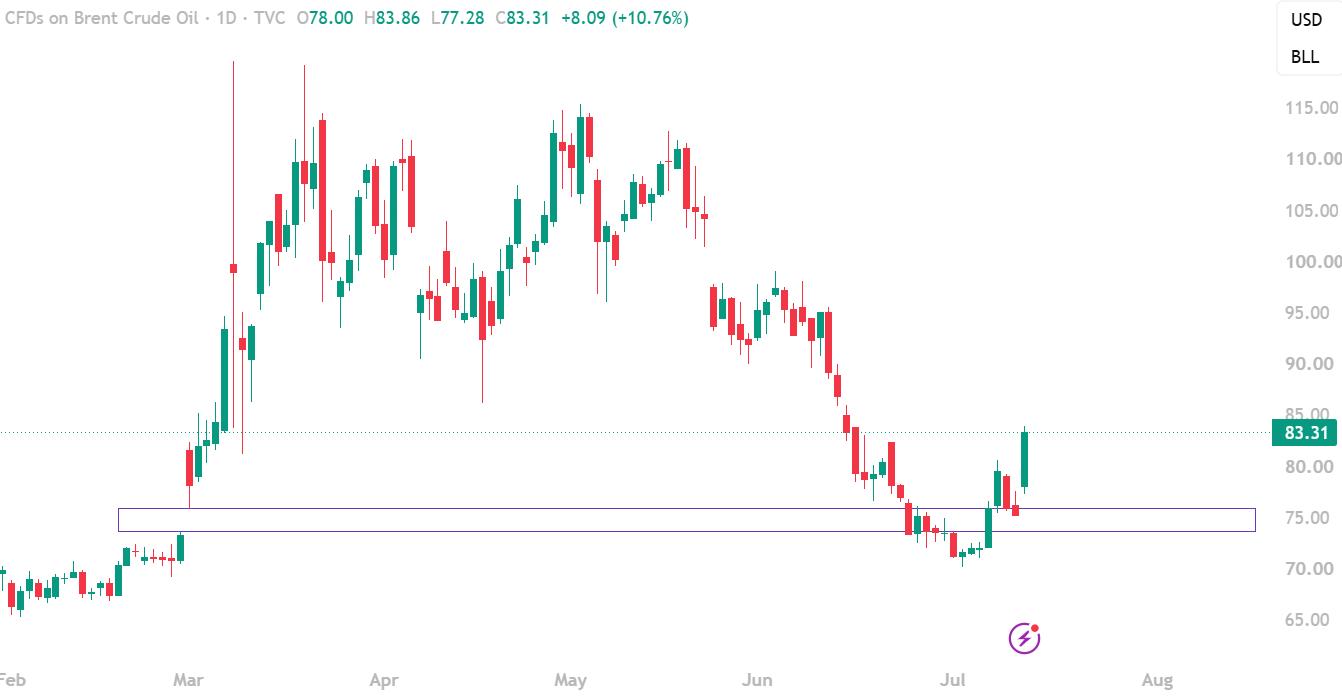
Source: Tradingview.com UKOIL/USD
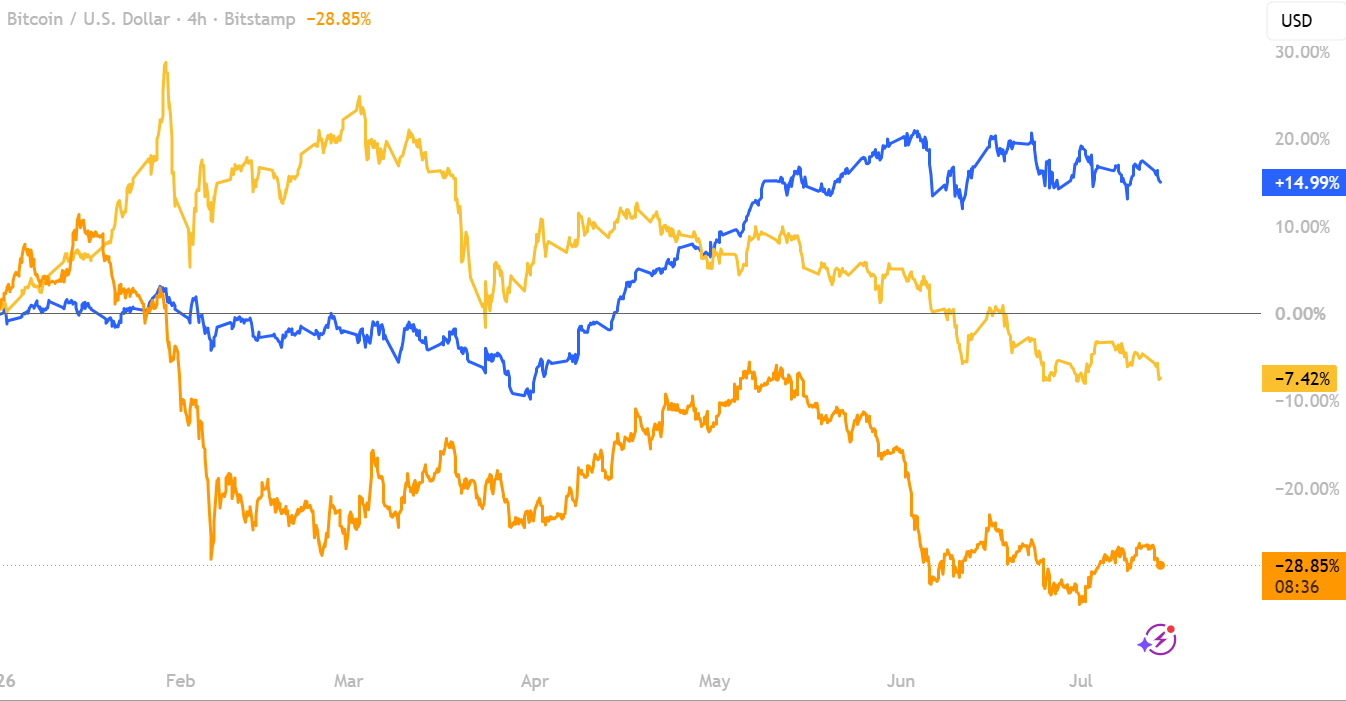
Bitcoin vs Gold vs Nasdaq YTD
🟡 Gold: -7.42%
🔵 NASDAQ: +14.99%
🟠 Bitcoin: -28.85%
All three assets drifted lower this week, with the broader picture largely unchanged since early June: everything is stuck in a range.
Bitcoin slipped from -26.96% to -28.85% year-to-date, giving back some of last week's recovery. BTC has essentially been chopping sideways since its early June lows, and remains the weakest performer of the three by a wide margin.
Gold fell from -4.07% to -7.42% year-to-date, undoing most of its recent push back toward flat. The metal has struggled to hold momentum despite the geopolitical backdrop, which would typically be supportive.
The Nasdaq eased from +16.25% to +14.99% year-to-date. Even with the pullback, its lead over both gold and Bitcoin remains comfortable, and it's still the only one of the three in positive territory this year.
For now, all three are rangebound, with no asset making a decisive move in either direction since early June.
Source: Tradingview, BTC, GOLD, NASDAQ
BTC
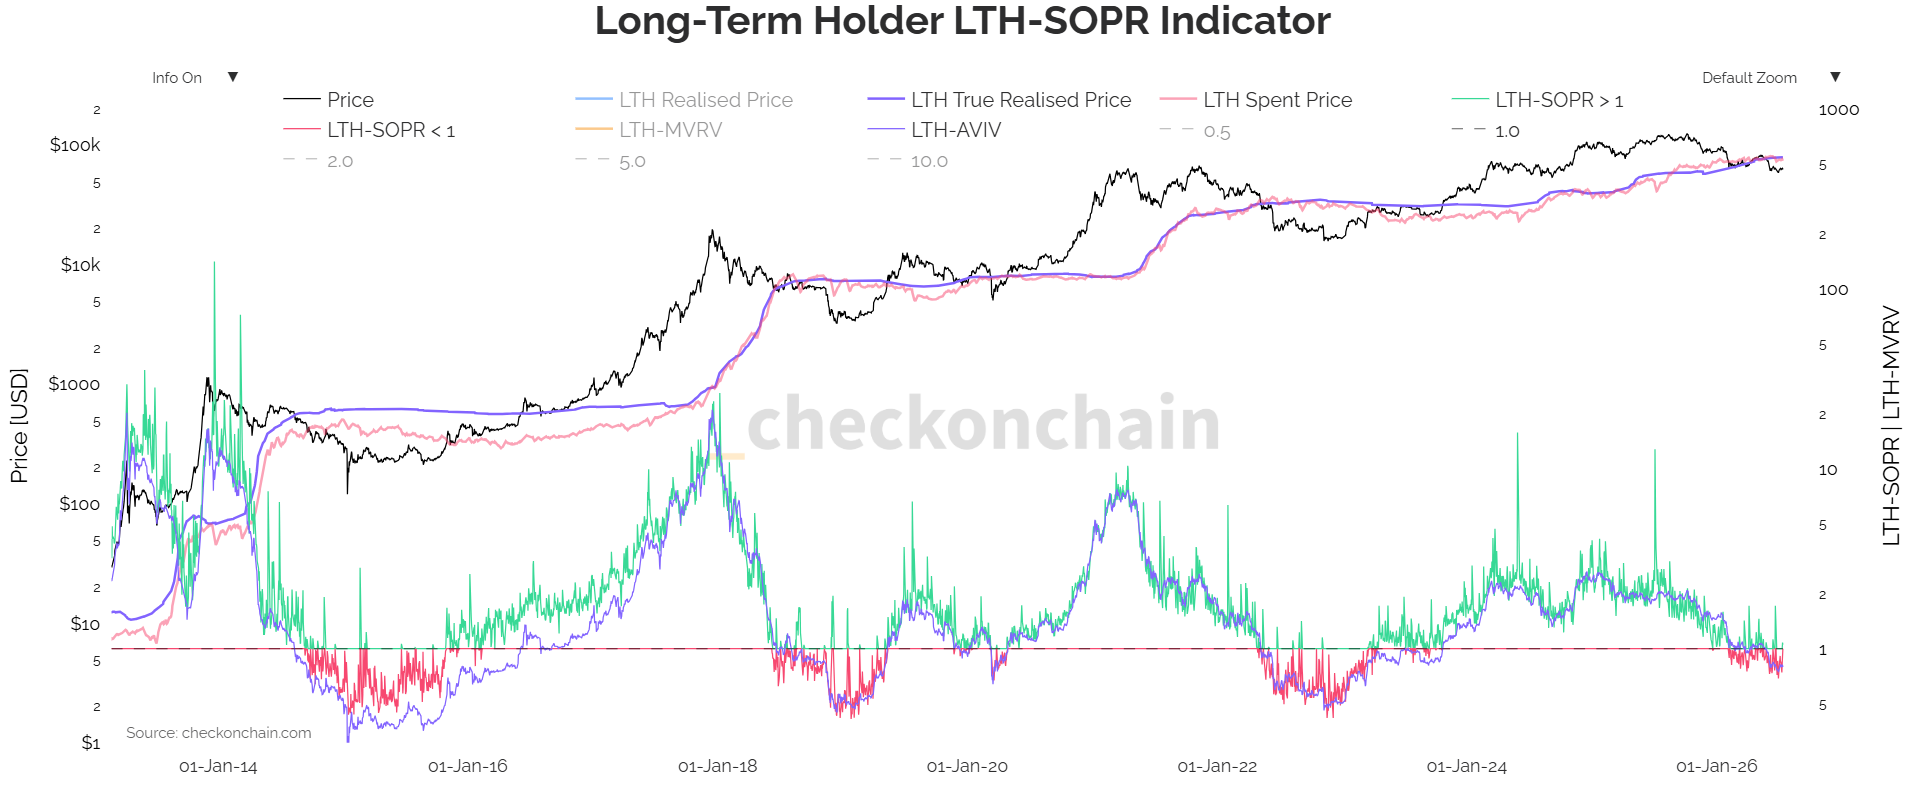
On-chain check: Long-term holders under pressure
Source: checkmatey https://charts.checkonchain.com/btconchain/realised/lthsopr_indicator/lthsopr_indicator_light.html
Long-term holder SOPR (Spent Output Profit Ratio) is worth a look this week. In plain terms, it measures whether coins held for a long time are being sold at a profit (above 1) or at a loss (below 1). Right now the indicator has dipped below 1, meaning some long-term holders are spending coins at a loss, something that historically has only happened in the deeper parts of bear markets, like late 2018, 2022, and briefly at other cycle lows.
There's an important nuance here though, courtesy of on-chain analyst Checkmate. The standard long-term holder "cost basis" metric counts every coin held for at least five months, including hundreds of billions of dollars in lost and ancient coins that will never move. All that unrealised profit locked in dead wallets drags the average cost basis down, making real, active long-term holders look healthier than they are. Adjusting for this (dividing by "liveliness") gives a truer read on what actual living, breathing holders paid, and it suggests the average real holder's cost basis sits higher than the headline number implies.
The takeaway: some long-term holders are capitulating at a loss, which has historically clustered around late-cycle lows, but as always, on-chain signals describe what's happening, not what comes next.
SOL
Japan just handed Solana its biggest institutional win of the year. On July 13, SBI Holdings, one of Japan's largest financial groups with around $230 billion in assets, announced SBI Solana Global, a joint venture with the Solana Foundation to build Japan's first on-chain financial market, covering yen stablecoins, tokenized bonds and real estate, and cross-border settlement. Sumitomo Mitsui, one of Japan's three biggest banking groups, is also on board.
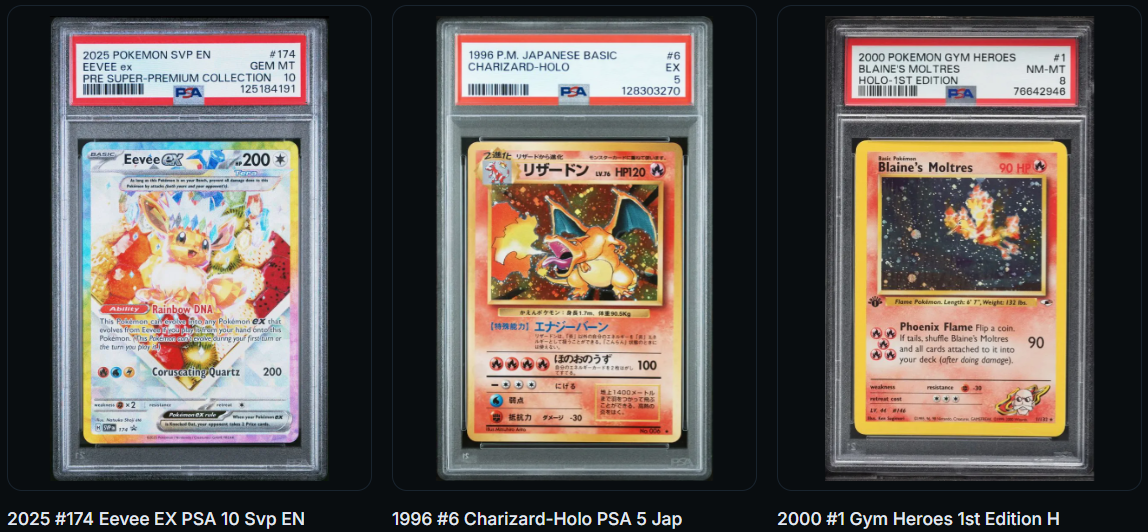
Meanwhile, Jupiter launched something a little more fun: Jupiter Gacha, where users buy packs of real, graded Pokémon and One Piece cards, tokenized and tradeable on-chain, with the physical card held in custody. It's exactly the tokenized collectibles shift we covered in last week's State of NFTs article. JUP ticked up around 3% on the news.
Source: https://jup.ag/gacha/packs/pokemon_25
Institutional rails on one end, Pokémon packs on the other. Solana covered both ends of the spectrum this week.
ALTCOINS
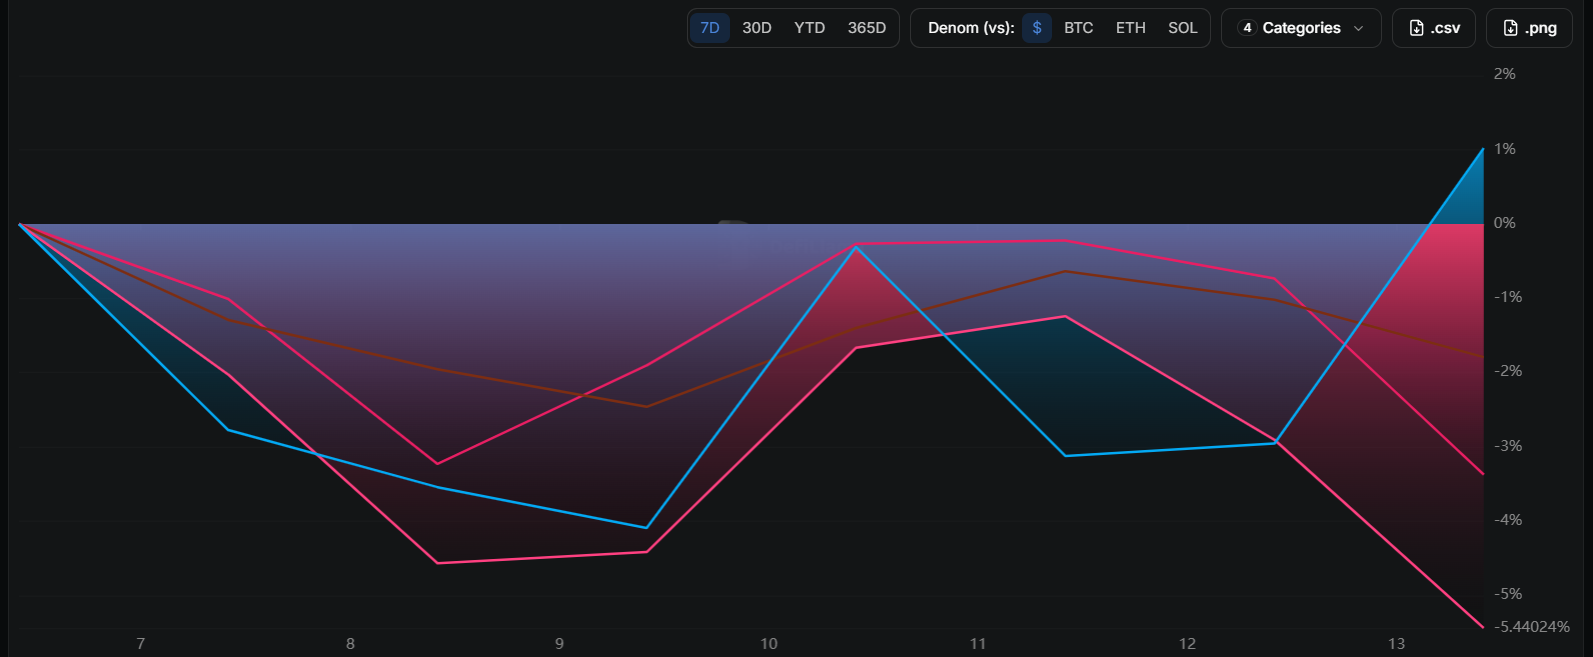
Last week's winners became this week's losers. Meme coins went from leading the pack at +12.12% to propping up the bottom at -5.44%, with BONK's rough week, down over 16% on the back of the BonkDAO governance attack fallout, doing the category no favours.
GameFi was the only category to stay in the green, up a modest 1.02%. RWA slipped 1.79%, and DeFi gave back some of last week's gains, down 3.37%, though it could have been worse: UNI, ARB and POL all held up relatively well and softened the category's fall. The Robinhood Chain launch putting fresh volume through Uniswap and Arbitrum likely hasn't hurt either.
Source: https://defillama.com/narrative-tracker
Story of the week:
Robinhood launched its own blockchain on July 1, and two weeks in, the numbers are hard to ignore. Robinhood Chain, a Layer 2 built on Arbitrum that settles on Ethereum, has already cleared $3.1 billion in DEX trading volume, pushing it into the top five chains globally by that metric and past heavyweights like Ethereum mainnet and Base on daily volume.
The twist? Robinhood spent over a year building the chain around tokenized stocks, letting users trade digital versions of companies like Apple and Nvidia in over 120 countries. But the early action has come from somewhere else entirely: meme coins. The biggest token on the network is Cash Cat, a $150 million market cap coin modelled on a picture of a cat, and one early trader reportedly turned $85 into more than $2 million in paper gains. Meanwhile, the tokenized stocks the chain was actually built for hold a comparatively modest $13 million across 65,000 holders.
Worth knowing before reading too much into the volume: Robinhood is currently paying every user's gas fee under a 90-day subsidy running until late September. Zero-cost transactions are doing a lot of heavy lifting, on one day the network processed 7.6 million transactions but generated only about $4,000 in protocol fees. The real test comes in October when users start paying their own way.
Still, the launch has been a win for Ethereum, with the chain using ETH for gas fees, and Bernstein notes activity is already shifting from meme coins toward tokenized assets and perpetual futures. Whether the momentum survives the end of the subsidy is the question nobody can answer yet.
THIS WEEK’S INSIGHTS
Scam Alert: Deepfakes, AI and the New Crypto Scam Playbook
Scams used to be easy to spot: dodgy website, broken English, too good to be true. Now AI is doing the heavy lifting, and it's getting scary good. Deepfake celebrity videos, cloned voices and polished fake trading platforms are catching out even careful investors, with one Aussie losing $80,000 after watching a fake Elon Musk interview. We also put your eyes to the test with twelve faces, six real, six AI-generated. Most people can't pick them.
Read the full article here: Scam Alert: Deepfakes, AI and the New Crypto Scam Playbook