The Weekly Wrap
The total crypto market cap fell 4.85% this week to $2.19T, following Monday’s sea of red that alone wiped 3.83% from the market. Meanwhile, Bitdeer continued reducing its Bitcoin holdings. After starting the year with roughly 2,000 BTC, the company now holds none.
Sentiment remains fragile. The Fear & Greed Index is still sitting in Extreme Fear territory. BTC and ETH ETFs recorded their fifth consecutive week of outflows, with $315.86M USD and $123.37M USD respectively.
Outside of crypto, markets are also reacting to renewed tariff plans from President Trump. Trade tensions can affect global supply chains, business confidence and overall risk appetite.
That brings the next data point into focus.
MACRO WATCH: ISM & SOUTH KOREA EXPORTS 👀
There’s an interesting relationship developing beneath the surface.
South Korea is one of the world’s most export-driven economies, heavily exposed to semiconductors, electronics and global manufacturing demand.
Historically, South Korean export growth has tended to lead the U.S. ISM Manufacturing PMI.
Why does that matter?
The ISM PMI is a survey of U.S. manufacturers.
Above 50 = expansion.
Below 50 = contraction.
Markets track it closely because manufacturing cycles influence earnings expectations, liquidity conditions and overall risk appetite.
Global trade activity often shows up in export data before it appears in business surveys like ISM.
Right now, exports are pushing higher again while ISM remains above 50.
If that relationship holds, it suggests manufacturing momentum may be stabilising rather than deteriorating, even with trade tensions back in focus.
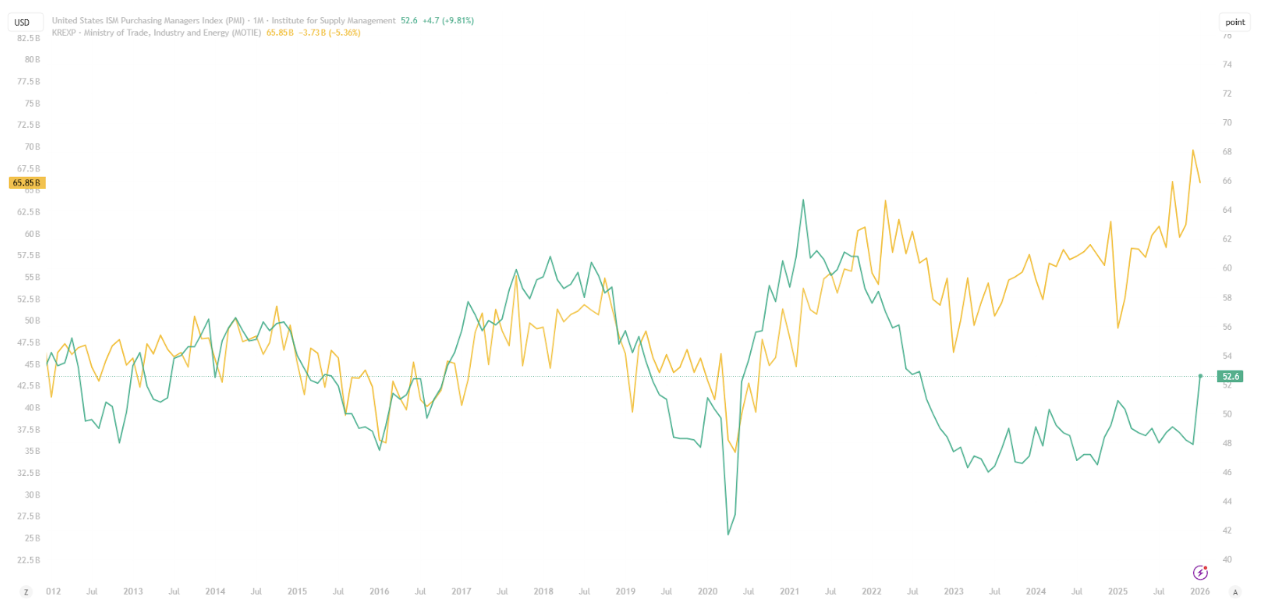
ISM = Green
South Korea Exports = Yellow
Source:tradingview USBCOI & KREXP
Over the last 7 days:
- Bitcoin (BTC) down 4.87%
- Ethereum (ETH) down 6.88%
- XRP up 8.63%
- Solana (SOL) up 7.70%
Other movers:
BTC
BTC is down 4.87% since the last report. Weekly RSI has moved into historically oversold territory, reflecting the intensity of the recent correction.
To understand the current environment, it helps to compare Bitcoin’s price action with prior market cycles.
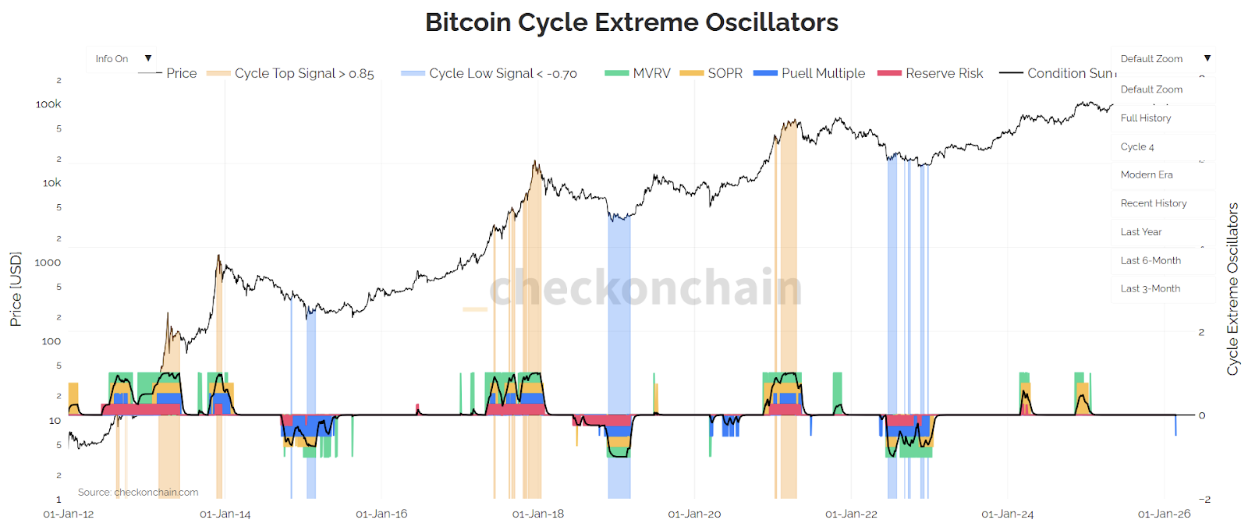
Bitcoin’s Cycle Extreme Oscillator combines several on-chain valuation metrics including MVRV, SOPR, Puell Multiple and Reserve Risk to assess where Bitcoin sits within a broader market cycle.
In simple terms, it measures whether the market is overheated, fairly valued, or deeply distressed based on investor profitability, miner behaviour and long-term conviction.
Blue zones on the chart have historically appeared during major capitulation phases such as 2015, 2018 and 2022, when investors were heavily underwater and valuation metrics reached extreme lows.
The model has not yet flashed a blue bear-market signal in this cycle. The model has not yet flashed a blue bear-market signal in this cycle. While price has corrected, the oscillator has not reached levels historically associated with full-cycle capitulation events.
ETH
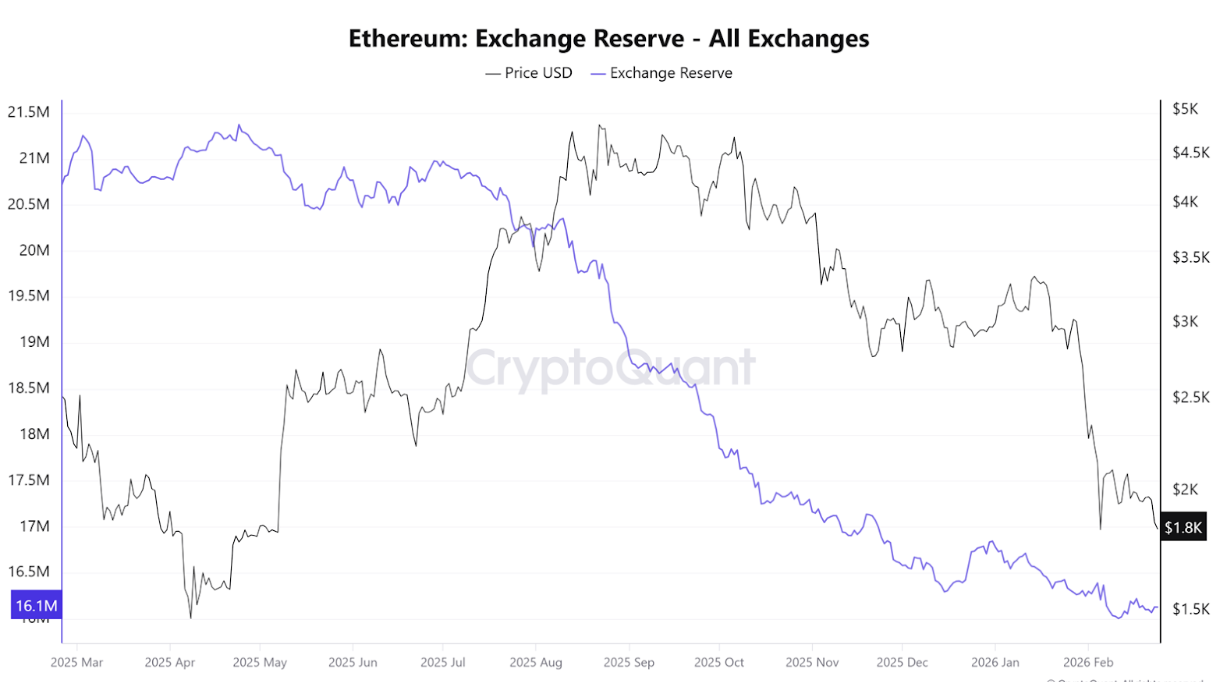
Ethereum exchange reserves continue to trend lower, meaning fewer ETH are sitting on centralised exchanges and available for immediate sale. Unlike previous capitulation phases, there has not been a sharp spike in exchange inflows. This suggests recent price weakness has not yet translated into broad panic distribution, with much of the supply remaining staked or held off-exchange.
ALTCOINS
SOL & XRP
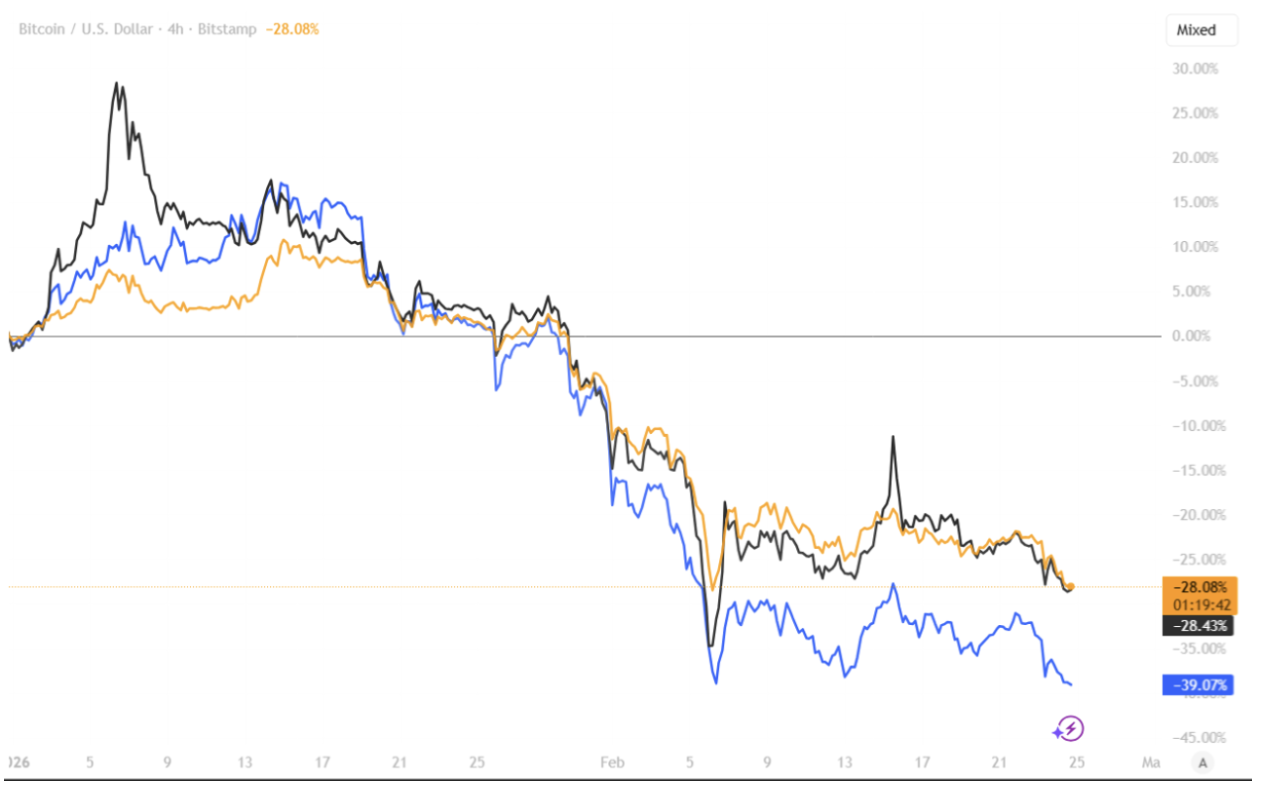
Bitcoin’s year-to-date pullback of roughly 28% has weighed on major altcoins. XRP is down 28.4%, broadly in line with BTC, while Solana has retraced 39.1%, reflecting the higher volatility typically seen in alt assets during corrective phases.
Altcoins generally exhibit higher beta to Bitcoin, meaning they tend to outperform during expansions and underperform during contractions. However, after a challenging 2025 for much of the altcoin market, some of the relative weakness had already been priced in earlier in the year. As a result, recent declines may reflect more of a continuation of that broader trend rather than a fresh wave of extreme underperformance.
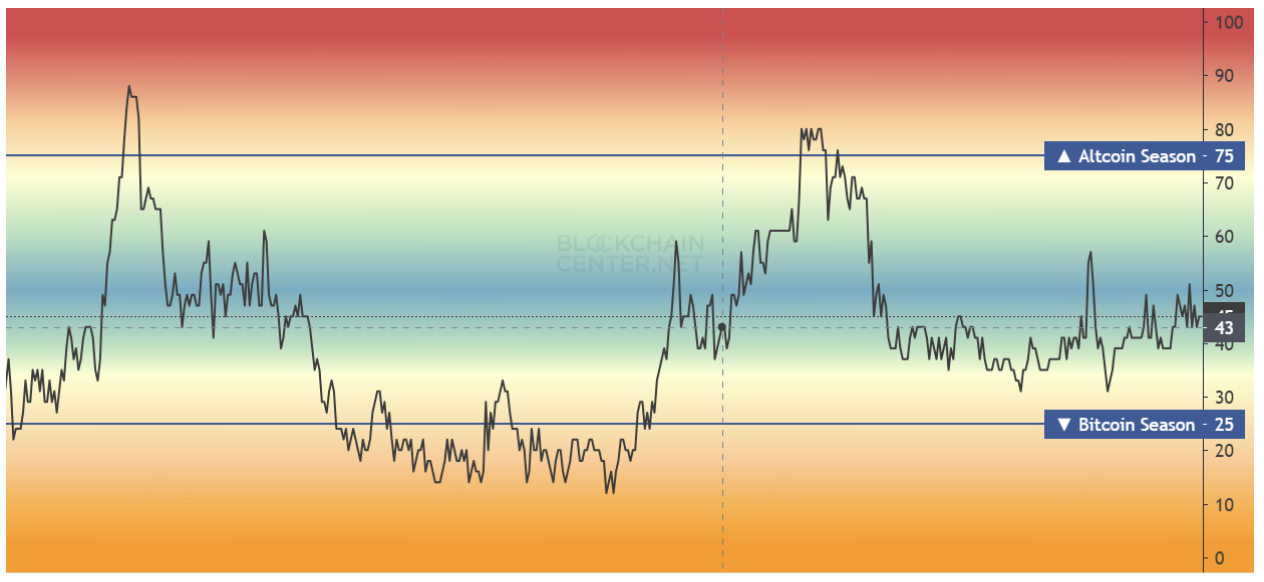
Altcoin Market
The Altcoin Season Index is sitting right in the middle right now.
Not high enough to scream “alt season.”
Not low enough to say Bitcoin is running the show
Historically, a move above 75 means alts are broadly outperforming BTC. A drop below 25 signals clear Bitcoin dominance. We’re nowhere near either extreme.
Translation: the market’s in a neutral zone. No clear leader. No broad rotation. Just consolidation and mixed performance across the board.
GOLD (PAXG)
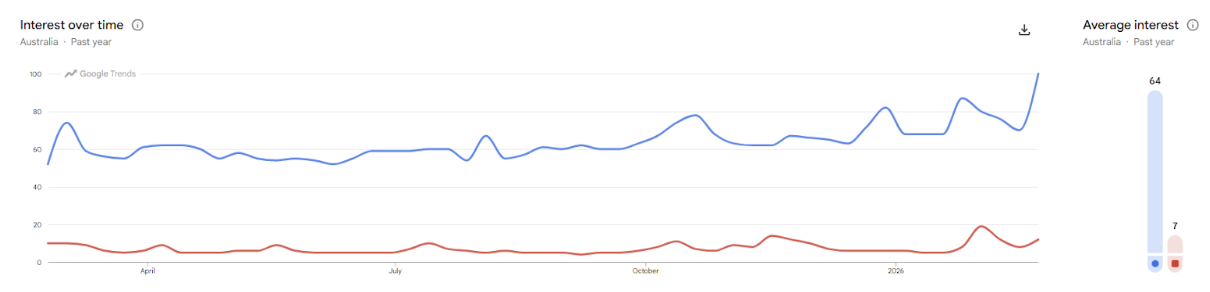
Gold is getting a lot more attention lately and still up 20.02% year to date.
Over the past few months, searches for “Gold” have picked up noticeably, while “Bitcoin” has stayed relatively flat.
Google searches for “Gold price” have increased more than 650%, while searches for “BTC price” are down roughly 7% over the same period.
This doesn’t automatically mean money has rotated but it does show where attention is building. In previous cycles, shifts in attention have sometimes preceded shifts in capital flows.
Right now, gold is winning the clicks as seen in the chart below.