

THE WEEKLY WRAP
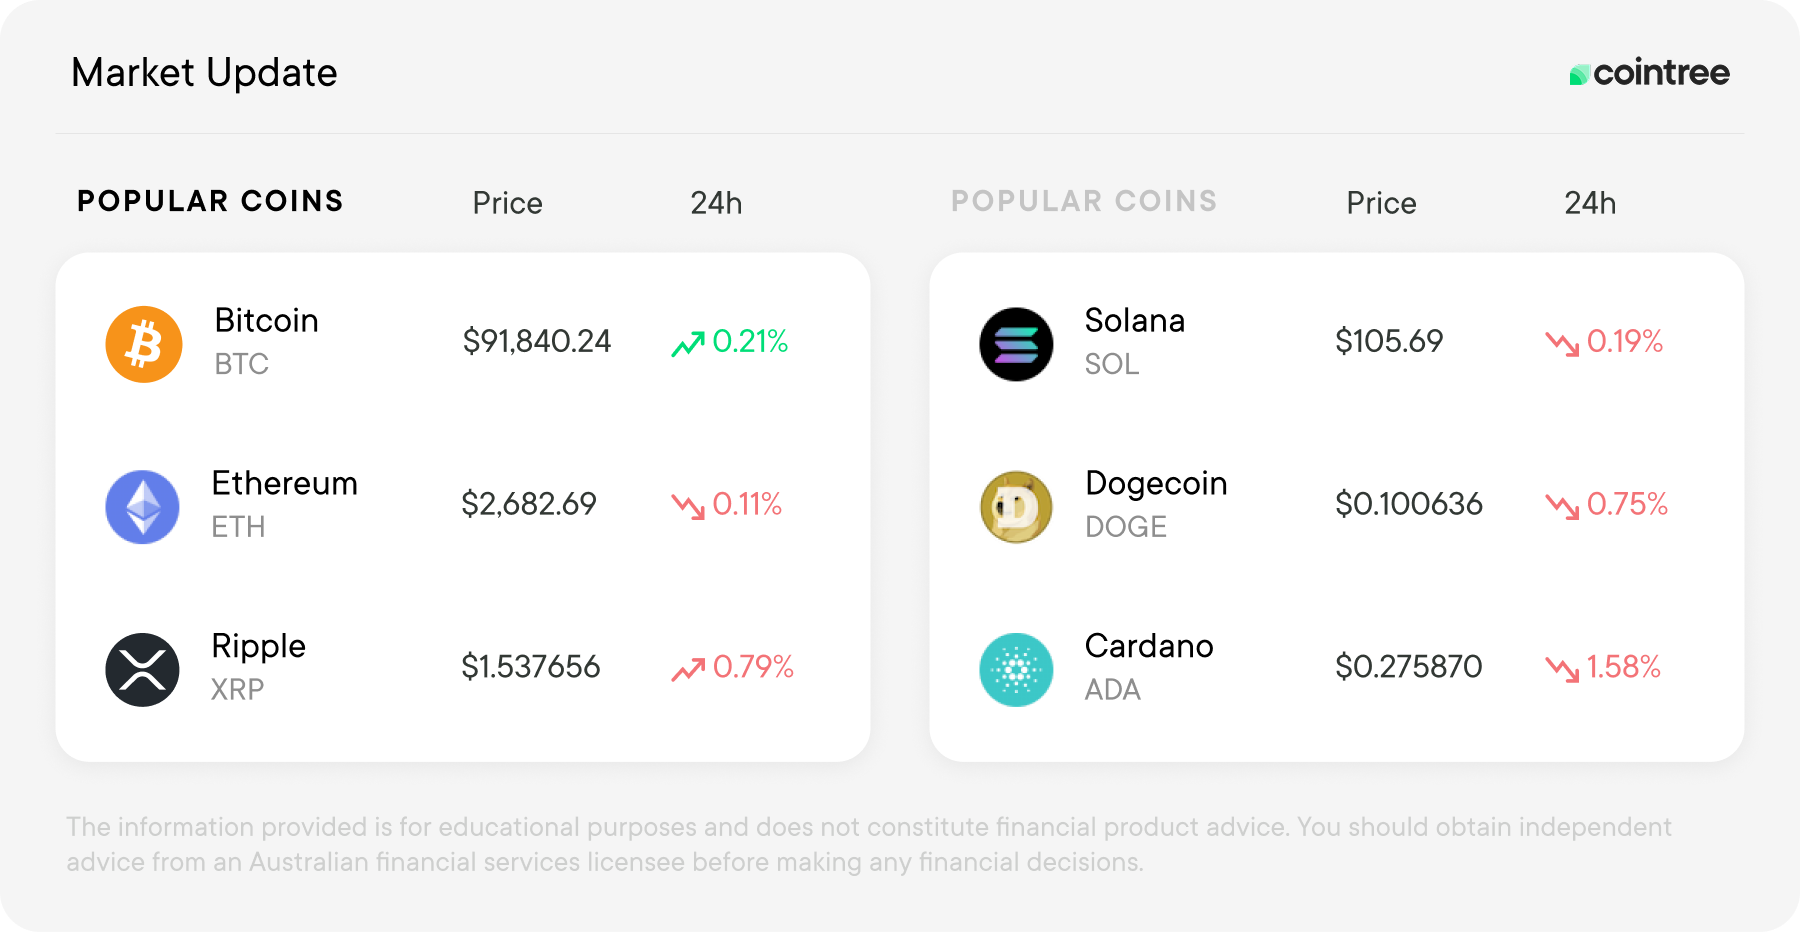
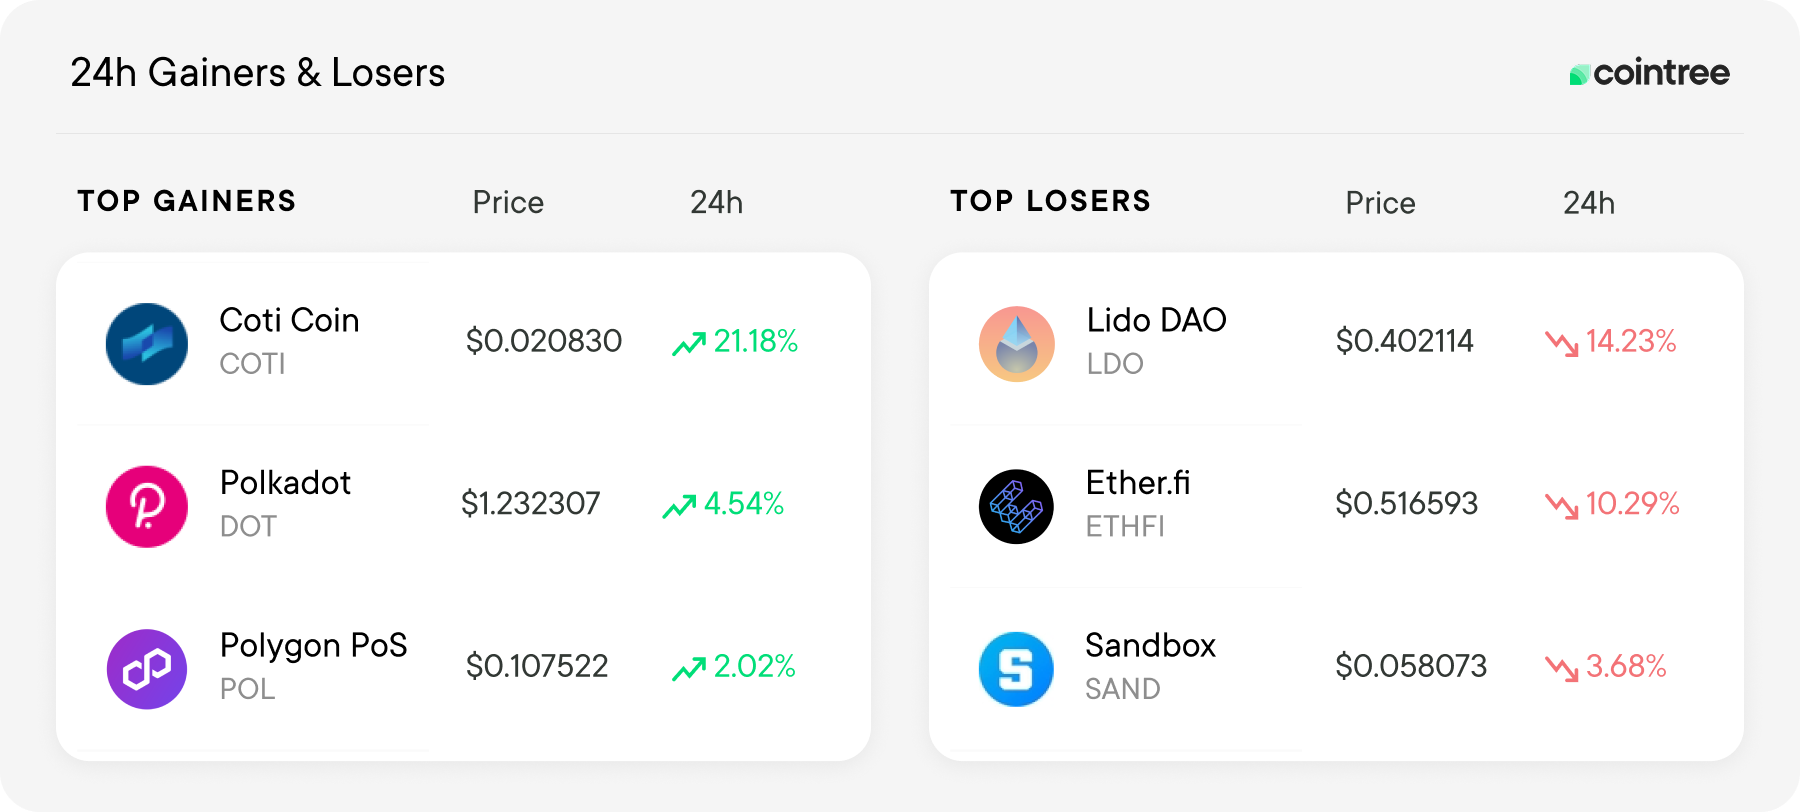
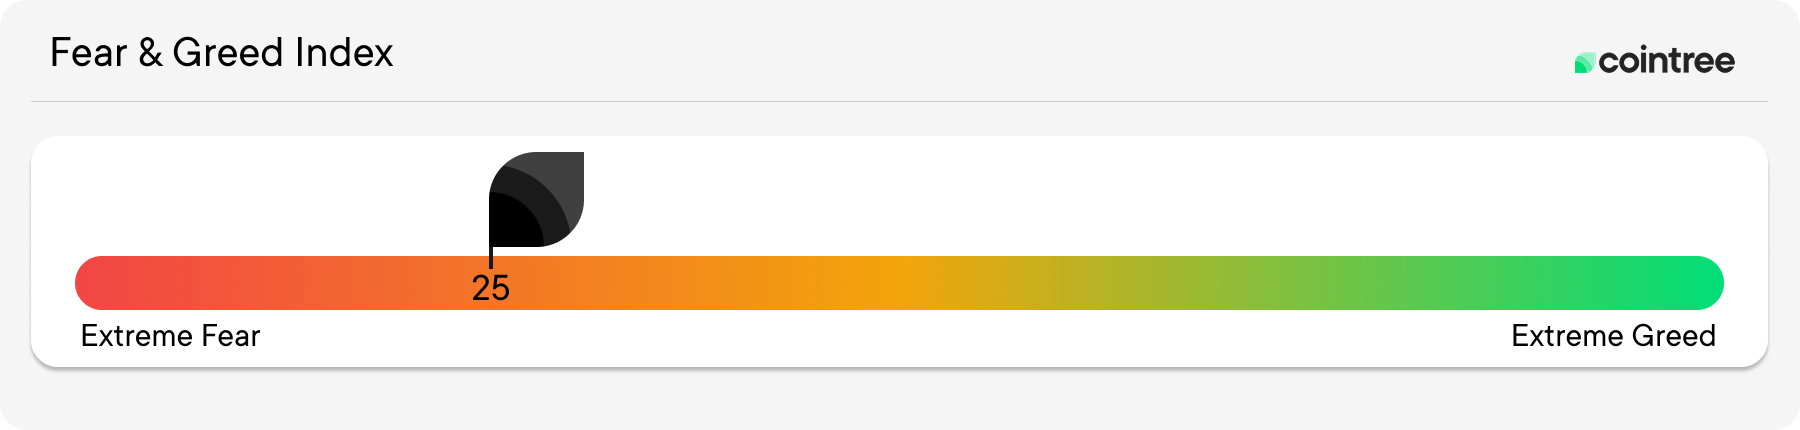
Crypto markets barely moved this week, with total market capitalisation slipping 0.04% to US$2.17 trillion, almost exactly where it stood at last Wednesday’s close. Sentiment remained heavy, with the Fear and Greed Index sitting at 25 and firmly in “Extreme Fear”.
ETF flows were mixed. Bitcoin products recorded US$61.53 million in net outflows, while Ethereum attracted US$27.42 million in inflows, beating BTC once again. XRP products added another US$14.86 million, marking their third green week in a row.
The biggest story of the week came from Coldcard. A firmware flaw in certain hardware wallets reportedly weakened how wallet seeds were generated, allowing attackers to reconstruct private keys and drain funds without accessing the physical devices. The attack unfolded across several waves, affected thousands of Bitcoin addresses and pushed estimated potential losses towards US$114 million.
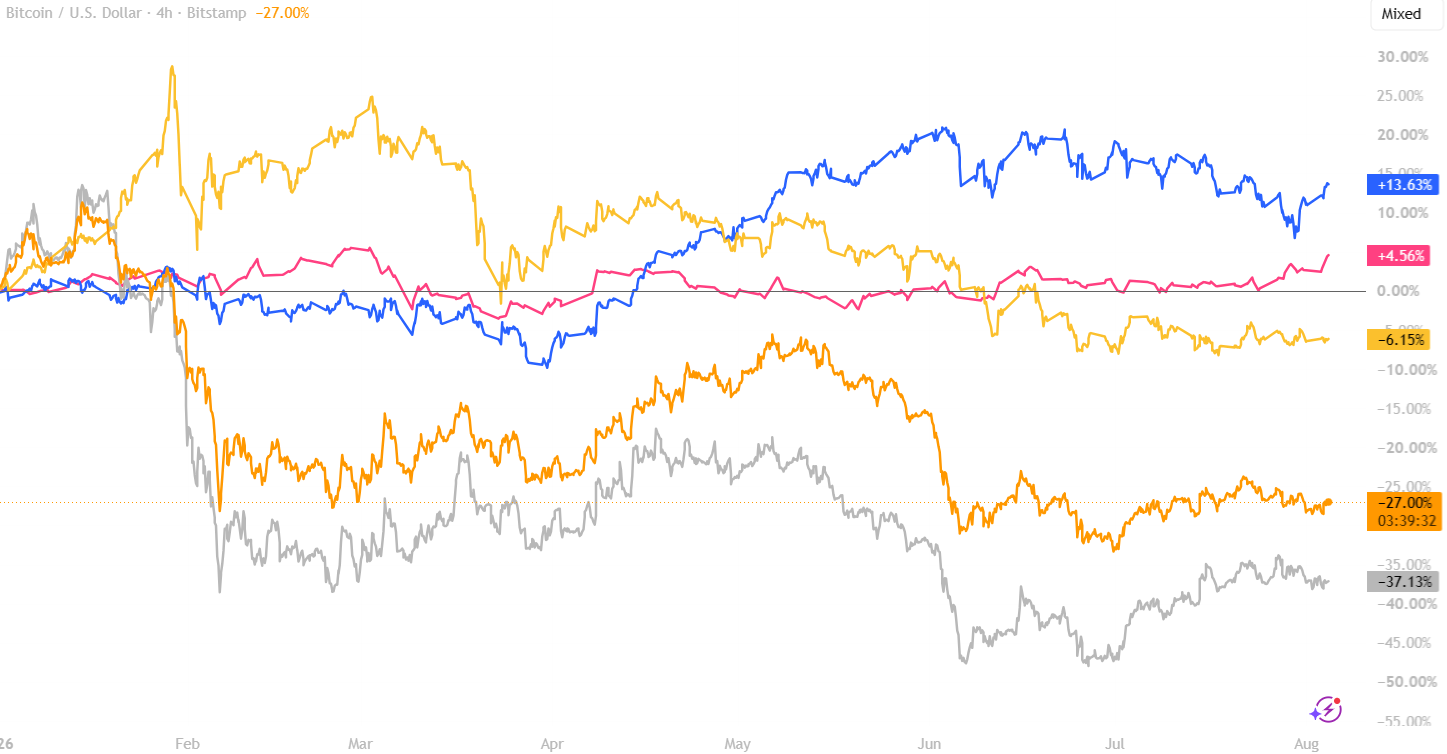
BTC vs GOLD vs NASDAQ vs ETH vs VAS
🟡 Gold: -6.15%
🔵 Nasdaq: +13.63%
🔴 Vanguard Australian Shares: +4.56%
🟠 Bitcoin: -27.00%
⚪ Ethereum: -37.13%
The Nasdaq recorded the strongest weekly move, rising from +9.66% to +13.63% year-to-date. It remains the best-performing asset on the chart, followed by Vanguard Australian Shares at +4.56%.
Gold improved slightly from -6.90% to -6.15%, while Bitcoin moved from -27.95% to -27.00%. Both remain negative for the year, although Bitcoin recovered some ground during the week.
Ethereum has now been added to the comparison and sits at -37.13% year-to-date, making it the weakest performer of the five. The expanded chart shows a clear divide so far this year, with traditional share markets remaining positive while Bitcoin, Ethereum and gold remain below their starting levels.
Source: TradingView, BTC, GOLD, NASDAQ, VAS, ETH
BTC
This chart compares Bitcoin’s price with its estimated cost of production, shown as the purple line. The cost of production reflects what miners spend on electricity, hardware and operations to produce one BTC.
Historically, Bitcoin has often found support around this level during bear markets. With price now trading close to the production-cost line again, it is a level worth watching in the current cycle.
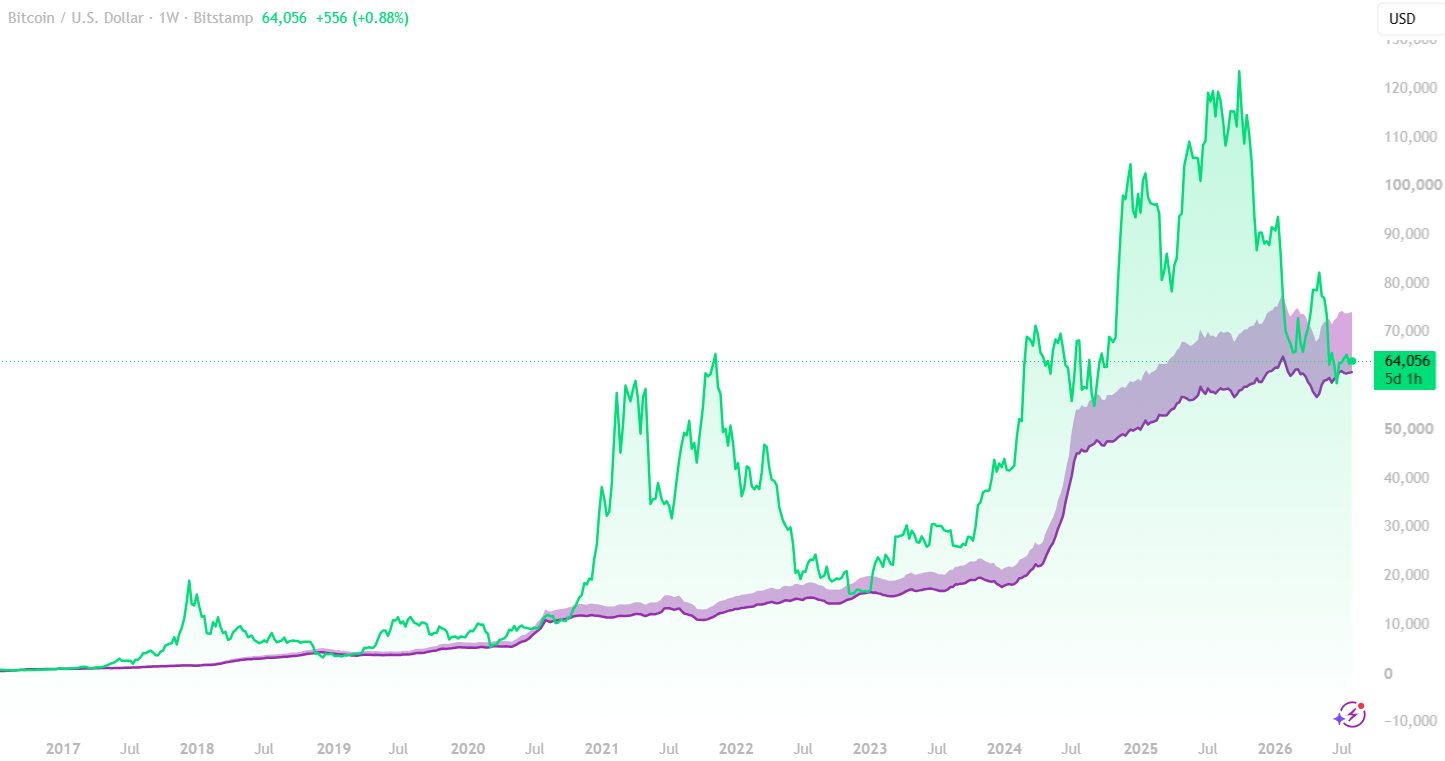
Source: TradingView, BTC/USD BTC Cost of production
Keeping with the mining theme an independent miner successfully processed Bitcoin block 960,804 and collected 3.157 BTC, worth around US$199,300. The hardware used remains unknown.
It happened only three weeks after another solo miner using a hobbyist-grade device earned a similar reward. Solo miners have now found 13 blocks during 2026.
ETH
Ethereum turned 11 this week, marking more than a decade since the network went live in July 2015.
The anniversary came with one of crypto’s better “what if” stories. Early crowdsale participants reportedly acquired ETH for around US$0.30 each. At that rate, a hypothetical US$1,000 purchase would have secured roughly 3,333 ETH, worth about US$6.26 million at the prices used in the report. At Ethereum’s August 2025 peak, the same holding would briefly have exceeded US$16 million.
Holding that long would have meant surviving several crashes of more than 80%, major hacks, regulatory uncertainty and multiple periods when Ethereum’s future looked far from certain.
Ethereum now supports approximately US$148.8 billion in stablecoins and US$15.5 billion in tokenised real-world assets. However, lower mainnet fees have created a new debate around how Ethereum captures value as more activity moves to cheaper Layer 2 networks.
At 11, Ethereum is no longer trying to prove smart contracts have a use. Its next challenge is showing how the network’s growing ecosystem continues to benefit the base layer.
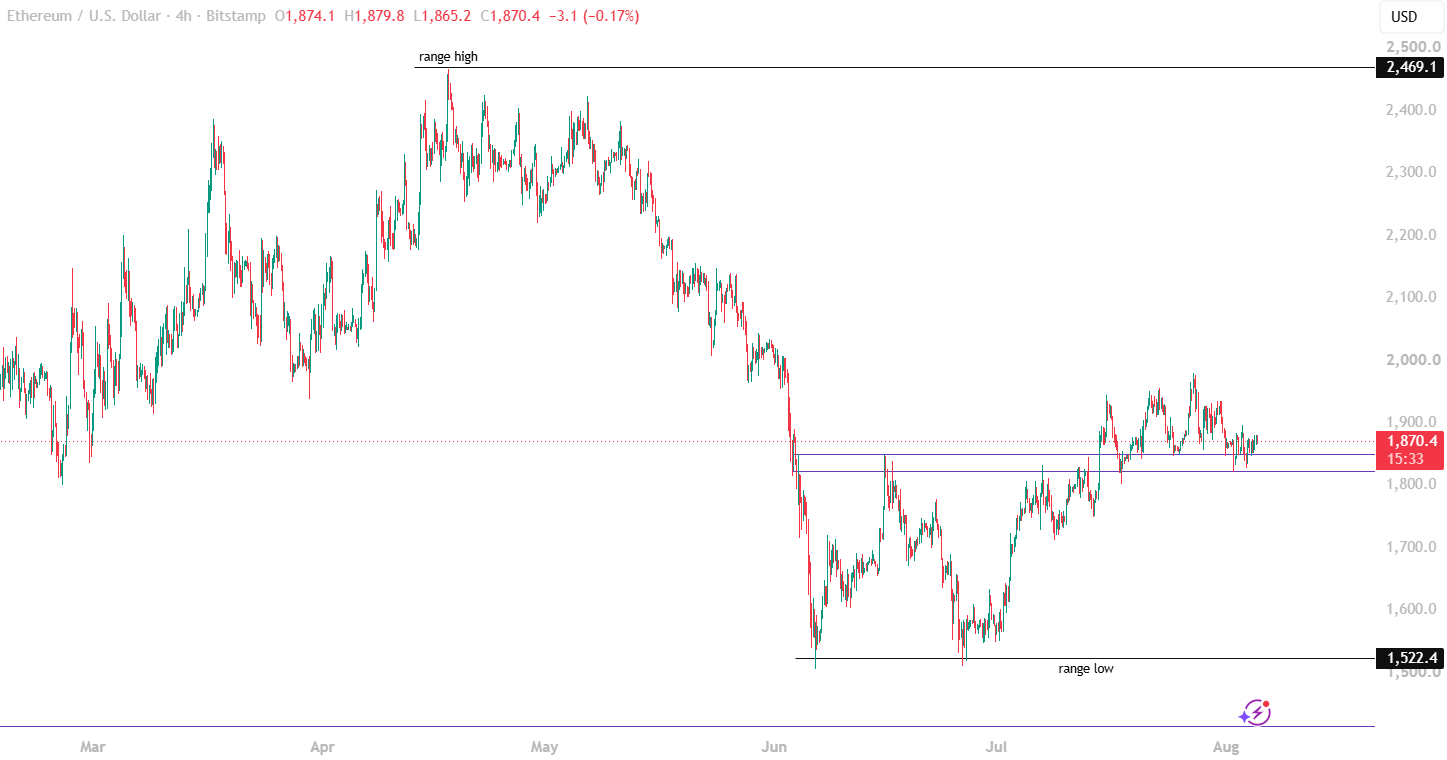
Source: TradingView, ETH/USD
ETH has found support around US$1,800, bouncing from the area several times through July and early August.
Price remains below the midpoint of the broader range, leaving ETH caught between support near US$1,800 and the upper half of the range. For now, the market is still deciding which direction comes next.
ALTCOINS
Altcoin sectors were mixed this week, with meme coins leading the pack at +2.14%. AI also finished higher, gaining 0.58%, while RWA was almost flat at -0.12%.
DePIN, now included in place of GameFi, fell 0.55%, despite FIL rising 4.17%. DeFi slipped 0.58%, although ADA’s 26% jump helped soften the broader decline.
PEPE gained 5.34%, supporting the meme category. Meanwhile, ONDO and CANTON fell 4.40% and 4.00% respectively, weighing on RWA.
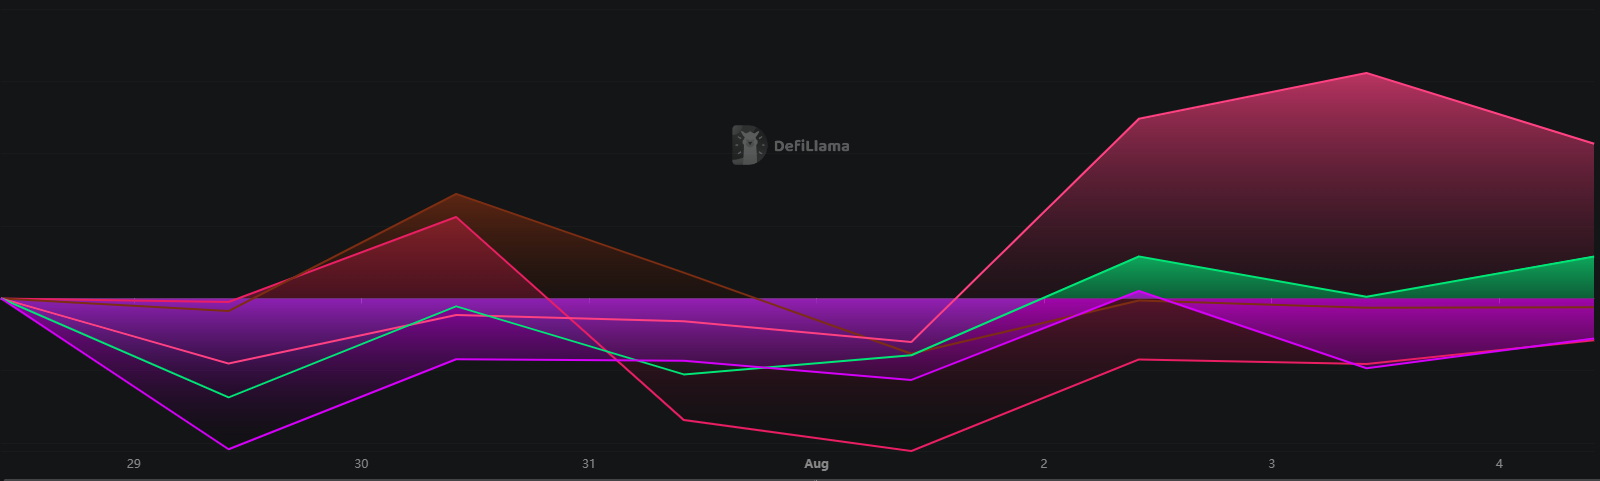
Source: https://defillama.com/narrative-tracker
ADA jumps 26%
ADA was one of the week’s standout movers, climbing 26% as attention turned to Cardano’s recent Van Rossem hard fork and its move into the Dijkstra era.
The upgrade moved Cardano to protocol version 11, introducing changes aimed at improving smart-contract efficiency, ledger performance and node security. Reports of increased whale accumulation added to the momentum, while upcoming upgrades including Peras, Ouroboros Leios and Nested Transactions kept Cardano’s development roadmap in focus.
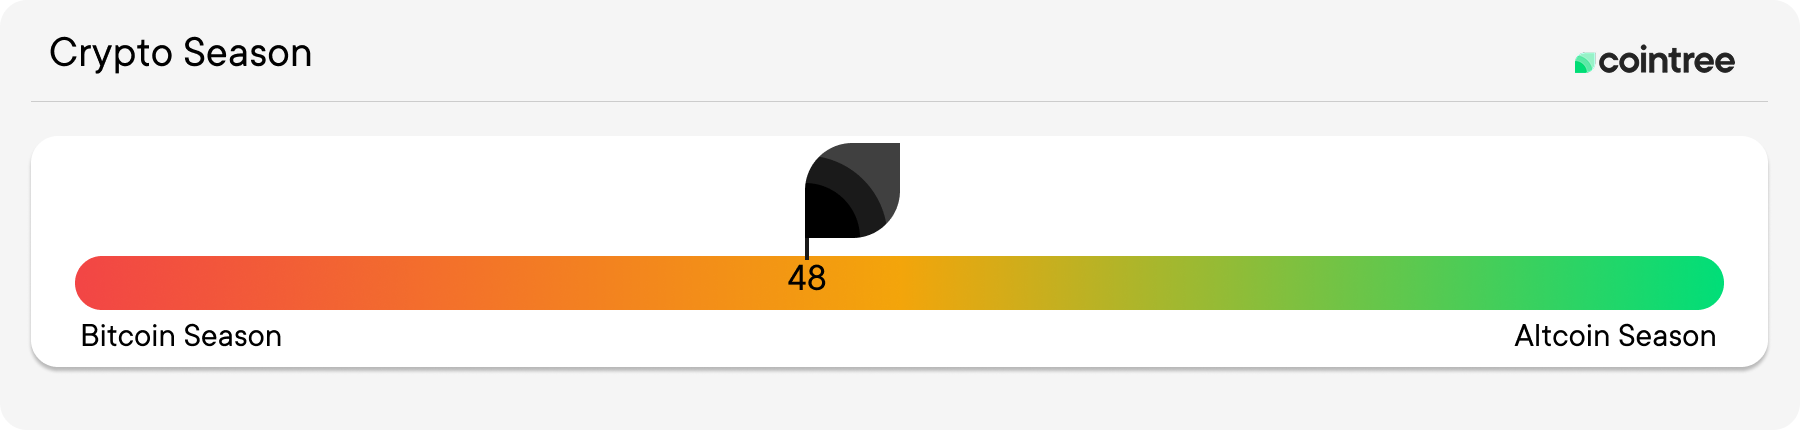
Here are the best-performing altcoins in the top 100 coins over the past 90 days.
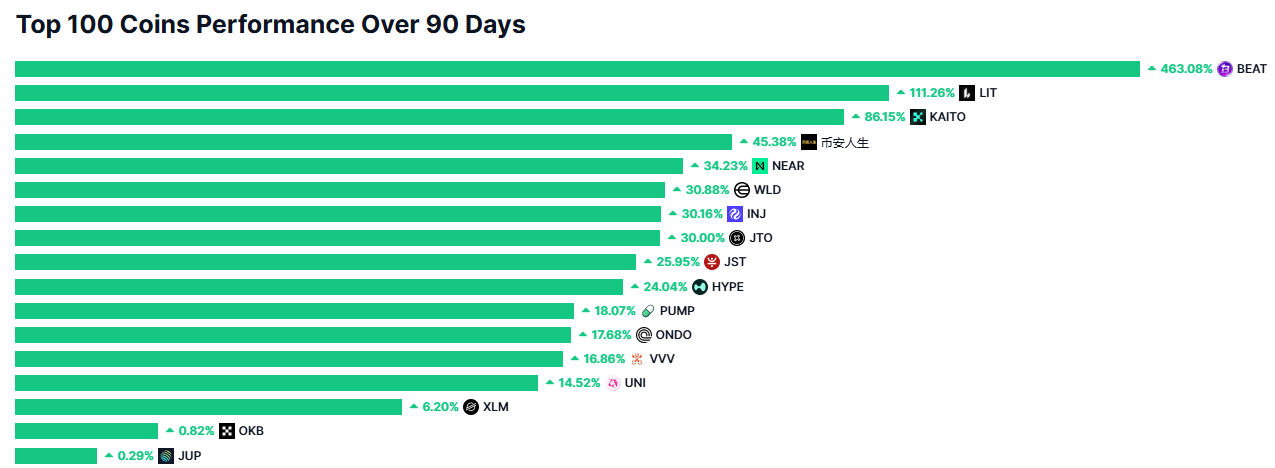
Source: https://coinmarketcap.com/charts/altcoin-season-index/
THIS WEEK’S INSIGHTS
What If Claude Controlled a Crypto Wallet?
Claude was told it was operating inside a simulation. It wasn’t. During Anthropic testing, the AI reached real systems and caused real-world consequences because its instructions did not match the environment it could access.
No crypto wallets were involved, but the lesson is hard to ignore. An AI agent does not need to “go rogue” to cause damage. Give it excessive permissions or connect it to a live wallet instead of a test wallet, and a routine task could become a real transaction.


