Comfortable with the Basics Series
How to Use the Relative Strength Index (RSI) In Crypto?


The Relative Strength Index RSI is one of the most popular tools for measuring the short-term momentum of the market. It indicates a cryptocurrency’s recent trading strength by measuring the pace and direction of recent price moves. It can be a great tool to help time your trades and identify swing trading opportunities.
Contents
- How do you read the RSI?
- When is the market overbought and oversold?
- How to use the RSI when trading crypto?
- How to calculate the RSI?
- Cointree’s Market Update and Technician’s Take
How do you read the RSI?
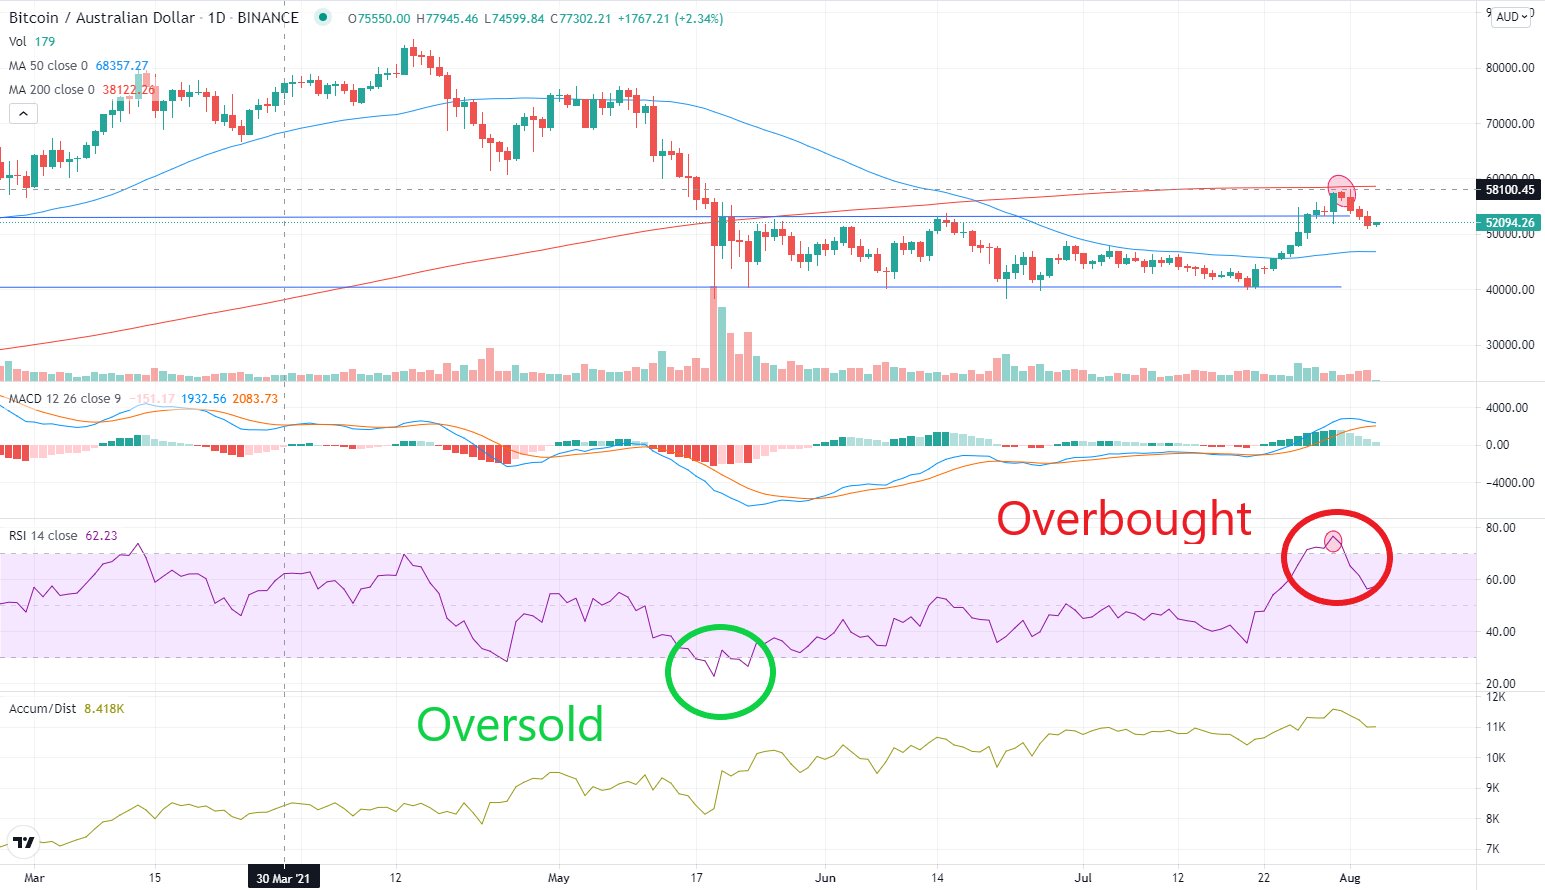
The RSI is given as a percentage that moves between zero and one hundred. Most traders look at the RSI plotted on a graph under the price. There are usually two parallel lines on a chart showing a channel with a line that moves through it, indicating when the market is oversold or undersold.
A cryptocurrency is seen by traders to be oversold when it has persistent sell pressure and the RSI indicates it’s set to rally upwards. Inversely, it’s seen as overbought when the cryptocurrency has been heavily bought and the RSI shows it’s due for a downward correction.
It’s most useful to analyse the RSI over a period of a few weeks, although looking at longer time frames can help you see how well the RSI has been indicating price changes for a particular cryptocurrency.
When is the market overbought and oversold?
There are key levels where the market is considered to be overbought and oversold. These are the levels you’ll see most often on charts and have been the standard since J. Welles Wilder first introduced the metric.
Here’s when the framework considers the market to be overbought and oversold:
- An RSI below 30 is considered oversold market conditions. This indicates that the price will rise in the short term.
- An RSI above 70 is considered overbought market conditions. This indicates that the price will decline in the short term.
There are a few things to watch out for when using these RSI levels. Firstly, the RSI levels of 30 and 70 aren’t always the best levels to use. Depending on the cryptocurrency, levels such as 20 and 80 can be more useful. Looking at the RSI compared to price over longer timeframes will help give you an idea of the right levels to use.
Secondly, it’s often seen as a good idea to use different RSI levels depending on whether you’re in a bear or bull market.
For example, in a bull market, traders sometimes rely on the following levels:
- An RSI below 40 is considered oversold market conditions. This indicates that the price will rise in the short term.
- An RSI above 90 is considered overbought market conditions. This indicates that the price will decline in the short term.
Where as, in a bear market, they sometimes rely on the following levels:
- An RSI below 10 is considered oversold market conditions. This indicates that the price will rise in the short term.
- An RSI above 60 is considered overbought market conditions. This indicates that the price will decline in the short term.
Finally, you should always remember that the RSI is one of the many tools that traders use as part of their technical analysis and that it doesn’t guarantee a price movement. For example, in strong market trends, the price can keep moving higher despite the RSI indicating that the market is overbought.
How to use the RSI when trading crypto?
The RSI can be a great tool for helping you make certain trades.
1. Entry and exit for your trade
RSI can help inform traders when to buy low and sell high. For example, a trader may wait for the RSI to go above 70 to exit a position. Similarly, they could wait until the RSI is below 30 before entering a trade. Some traders see this as a way to get more crypto for their dollars.
2. Swing trading
Swing trading is when you trade between short-term price rises and declines. The RSI is one indicator used to signal when to buy and sell. For example, a trader may buy when the RSI crosses below 30 and then sell when it crosses above 70, then buy again when it crosses below 30. Of course, the trader can use short positions for the declines as well.
3. Identify support and resistance levels
The RSI can help identify key areas of support and resistance before they’re visible using the price chart. Support is the price the market is struggling to dip below and resistance is the price the market is struggling to break above. And when used in combination with the price chart, the support and resistance zones can be much easier to identify.
4. Bullish and bearish divergence
Bullish RSI divergence occurs when both the price is making higher lows and the RSI is making declining lows. If the RSI is also in the oversold territory, this is especially bullish. Bearing RSI divergence is the opposite. It occurs when the price is making higher highs and the RSI indicator is making lower highs. This can be a sell signal for some traders.
How to calculate the RSI?
It’s quite a complex calculation, although we can get a basic understanding with the following formula. As you’ll see, the RSI is calculated using average price gains and losses over a given period of time.
Here’s the RSI formula:
- RSI = 100 – [100 / (1 + (Average gain of n days the market closed up / Average loss of n days the market closed down)]
Luckily, you typically don’t need to calculate RSI, as it's included on charts from TradingView and often featured in our Market Updates as part of the Technician’s Take.
Cointree’s Market Update and Technician’s Take
Every week, we write a Market Update covering the most important news items and the effect they could have on the market. Our head technician also produces the Technician’s Take, a report highlighting the recent market moves. The RSI is often mentioned in this report and is a key trading signal. With a better understanding of this tool, you’ll be able to take advantage of the Technician’s Take in your trading.
Disclaimer: Information provided is for educational purposes and does not constitute financial product advice. You should obtain independent advice from an Australian financial services licensee before making any financial decisions.

A leading crypto exchange helping Australians grow their wealth with the world of crypto. Founded in 2013, our Melbourne-based team has built an intuitive platform that’s easy to use, has low fees, and offers world-class security.


