Comfortable with the Basics Series
5 Key Financial Metrics to Evaluate a Cryptocurrency

In this guide, we look at five key financial metrics that many investors and traders use when deciding whether to buy a cryptocurrency, including market cap, supply and volume.
Many investors and traders use these metrics to:
- Discover projects with high growth potential
- Identify projects with strong network effects
- Avoid biases that affect decision making
You don’t have to calculate any of these financial metrics yourself—they're all available on every one of our coin pages. This guide simply shows you how many investors and traders are using them.
Contents
- Market capitalisation
- Volume 24hr
- Supply
- Max supply
- Price
- Where to find these metrics?
1. Market capitalisation
The market capitalisation or ‘market cap’ is the total value of a cryptocurrency project. It’s calculated by taking the current coin price multiplied by its current circulating supply. Here’s another way to look at it: The market cap is how much it would cost you to buy every single coin available (if you could actually do that without affecting the price).
Here’s the formula:
- Market cap = Current price x Current circulating supply
Here’s the volume of some of the most popular coins, as of the 30th of July 2021:
Market cap is one of the most popular financial metrics among traders because it shows how much money people have invested in the network. It also lets traders compare the market size of a cryptocurrency to other coins. Generally, the larger the market cap the more stable the project. However, smaller market cap coins often have more room to grow.
There’s an important caveat to consider when looking at a coin's market cap. You always need to check the volume before giving too much heed to the market cap. For example, you could issue 1 million tokens and sell one token to a friend for $100. While the market cap is technically $100 million, this is obviously misleading. Luckily, you can simply check the 24-hour volume to determine whether the market cap is reliable.
2. Volume 24hr
You probably can guess what ‘Volume 24hr’ means. That’s right, Volume 24hr is the total dollar value of all transactions over the past 24 hours. It’s a useful financial metric as it helps us determine how easily we can buy or sell the coin, also known as liquidity.
If the volume of a coin is low and you want to buy a lot, it may not be possible without driving up the price. On the other hand, if the volume is high, it’s easy to buy as much as you want. Overall, a high volume is a sign of a healthy market and gives many traders confidence in a project because it indicates that there is a lot of buying and selling behaviour in the market.
Here’s the volume of some of the most popular coins, as of the 30th of July 2021:
3. Supply
The supply is the number of coins that are in circulating supply. It’s important to note that supply isn’t an exact figure. It can be impossible to tell which tokens are being held by long-term investors, or which have been burned, lost or simply forgotten about. For example, of bitcoin’s 18.8 million current supply, an estimated 3.7 million bitcoin have been permanently removed from the supply, including a stack of 1.1 million bitcoin held by Satoshi Nakamoto.
Checking the supply can help make sure you’re not being influenced by the ‘unit price bias’, which is a phenomenon where people want to purchase tokens simply because they have a low unit price. For example, some people buy a token like Siacoin because the price is around only 1 cent and they can own hundreds of thousands or millions of them. While it may not be rational, it can feel good owning a million coins.
However, when we look at the 48.4 billion supply of Siacoin, suddenly our millions of coins are put in perspective. Now compare this to bitcoin. While an AU$1,000 investment will only buy a fraction of a single bitcoin, there is a much lower supply of 18.8 million.
Here’s the supply of some of the most popular coins, as of the 30th of July 2021:
4. Max supply
The maximum supply is the total amount that will ever be in circulation. In bitcoin, there will never be more than 21 million coins. While there are 18.8 million currently, only another 2.2 million coins are left to be mined. However, not every coin has a max supply.
As not every coin has a max supply, you can pay attention to its inflation instead. Inflation is the number of new coins that will be mined (created) over time. For example, Ethereum is currently inflationary, which means more coins are mined over time and the supply increases. However, the changes in Ethereum 2.0 could make it deflationary with more coins being burned (deleted) than mined, reducing the supply over time.
Here’s the max supply of some of the most popular coins, as of the 30th of July 2021:
As you may have noticed, bitcoin's current supply is only 18.8 million while its max supply is 21 million. That means that until all 21 million coins have been mined the bitcoin supply will continue to be slightly inflationary. As you may know, this inflation rate drops around every four years when the mining reward is halved. Known as the ‘halving’, many traders believe it has catalysed bitcoin's historic bull runs every four years.
5. Price
Many investors value ‘time in the market’ and are prepared to buy coins they believe in and hold for a long time. In contrast, traders try to ‘time the market’ over the short term, buying when the price is low and selling when the price is high. The recent price action is a key metric that traders look at, helping them determine whether the market looks bearish or bullish.
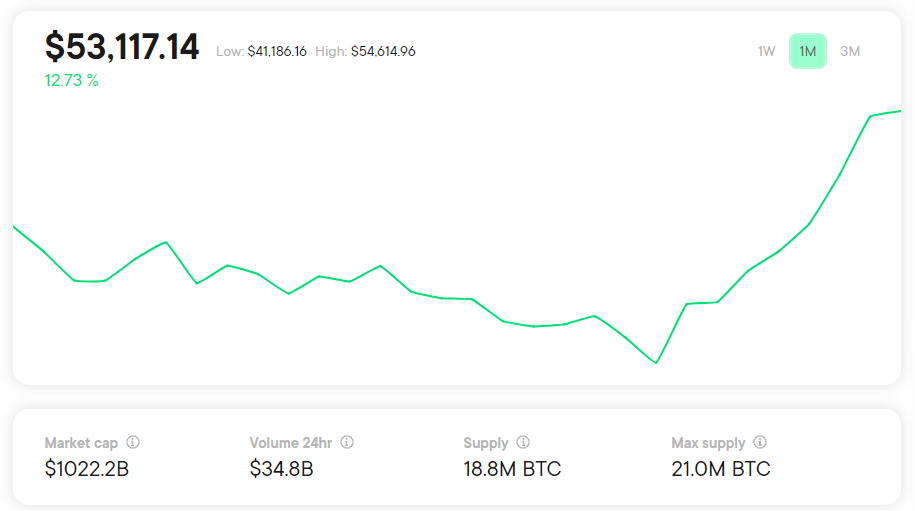
On Cointree, we provide price charts over the past week, month and quarter. Along with the chart, we identify the recent low and high. While traders are more focused on price, many investors pay close attention and make their investments when the price is favourable.
Here’s how much bitcoin’s price has varied over the past week, month and quarter, as of the 30th of July 2021:
- Week: AU$46,082 - AU$55,066
- Month: AU$41,186 - AU$55,066
- Quarter: AU$41,186 - AU$76,219
Where to find these metrics?
As the digital economy is growing so rapidly and there is so much new information available every day, these simple financial metrics can give you a quick overview and provide perspective on any project. Given they’re so useful, it’s important you have easy access to them.
All of these metrics are available on every coin page on Cointree’s platform. You can see a full list of the coins you can buy and sell on our exchange here. Of course, the max supply is only included on coins with a supply limit.
Along with these key financial metrics, we also provide the top performing portfolios so you can see what our top traders have been buying. While these portfolios may give you investing and trading ideas, the five key financial metrics we’ve covered are used by many traders to determine which cryptocurrencies to buy.\ Now that you’ve invested in your knowledge, are you ready to invest in cryptocurrencies? If so, you can explore over 160 cryptocurrencies on our exchange and evaluate the financial metrics before you invest.


