

The Weekly Wrap
Over the last 7 days:
- Bitcoin (BTC) up 6.71%
- Ethereum (ETH) up 6.66%
- XRP up 0.79%
- Solana (SOL) up 8.51%
Other movers:
Crypto finally caught a bid.
The total market cap is up 5.46% since last week, now sitting around $2.31T USD. Not explosive, but after weeks of pressure, green is green.
Sentiment, however, has not recovered. The Fear & Greed Index remains in Extreme Fear at 14. Price has bounced, but confidence has not followed.
Institutional flows improved. After five consecutive weeks of outflows, ETFs finally turned positive.
- BTC ETFs saw $787.31M in inflows
- ETH ETFs added $80.46M
This week’s Bitwise chart on Bitcoin’s probability of loss by holding period is worth having a look at.
- Short time horizons carry a high probability of loss.
- Longer time horizons show that probability falling sharply.
- At multi-year holds, historical loss probability trends toward zero.
- Volatility feels intense up close. Time has historically reduced that risk.
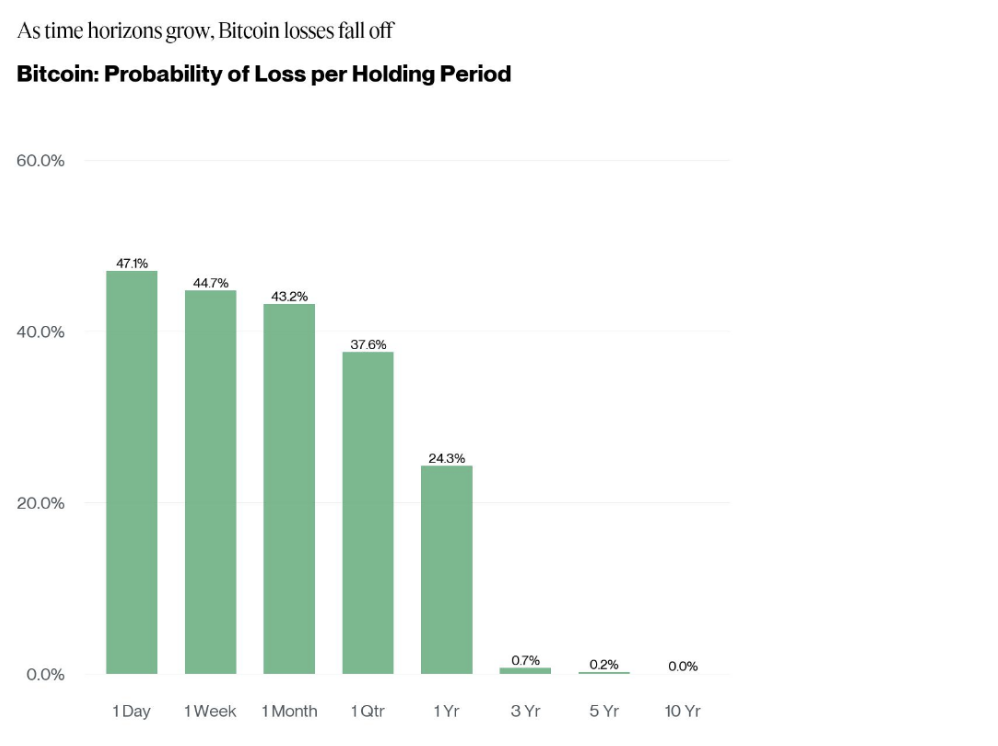
Source: Bitwise X account
Macro:
The crypto market held relatively firm over the weekend while traditional markets were closed amid rising tensions between the US and Iran. Bitcoin initially sold off from $65K to $63K but quickly recovered, highlighting the market’s ability to absorb geopolitical shocks in real time.
The ISM PMI printed 52.4, above 50 for two months straight. That signals economic expansion and is generally supportive of risk assets.
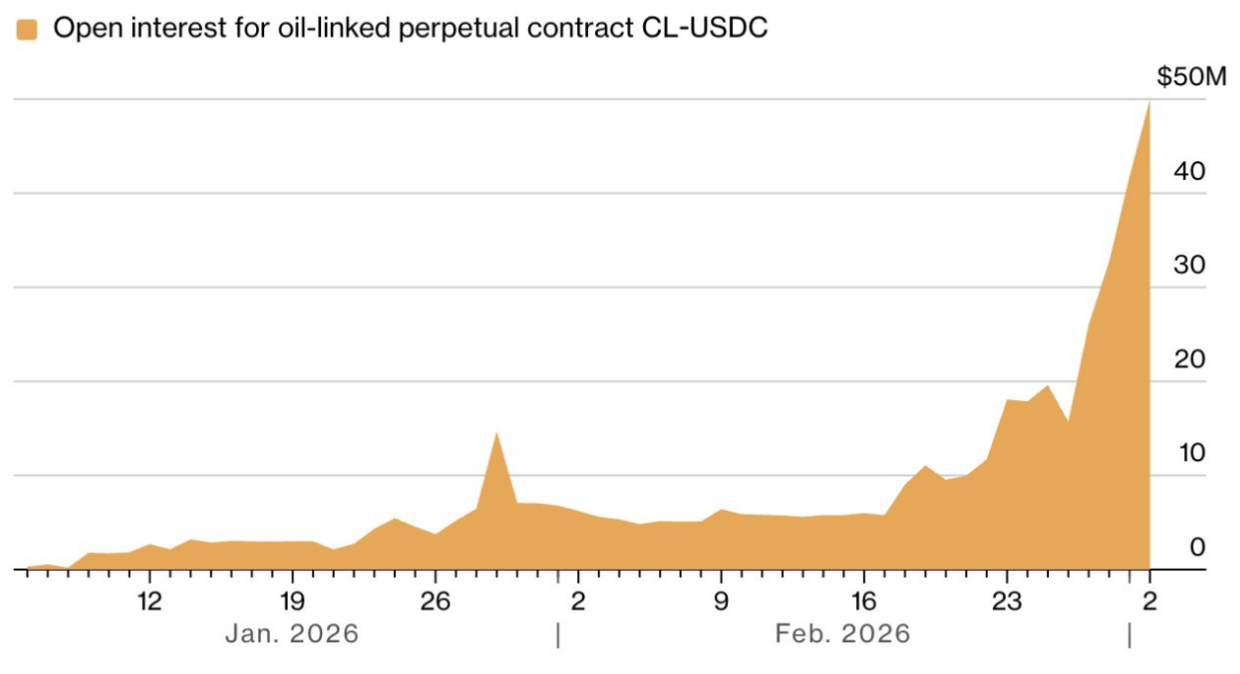
Meanwhile, traders are rotating into commodities. Open interest in oil-linked perpetual contracts has surged, following strong activity in gold and silver over recent months.
That is where we stand this week.
BTC
Bitcoin is up 6.71% since the last report, and ETF flows have finally flipped back positive.
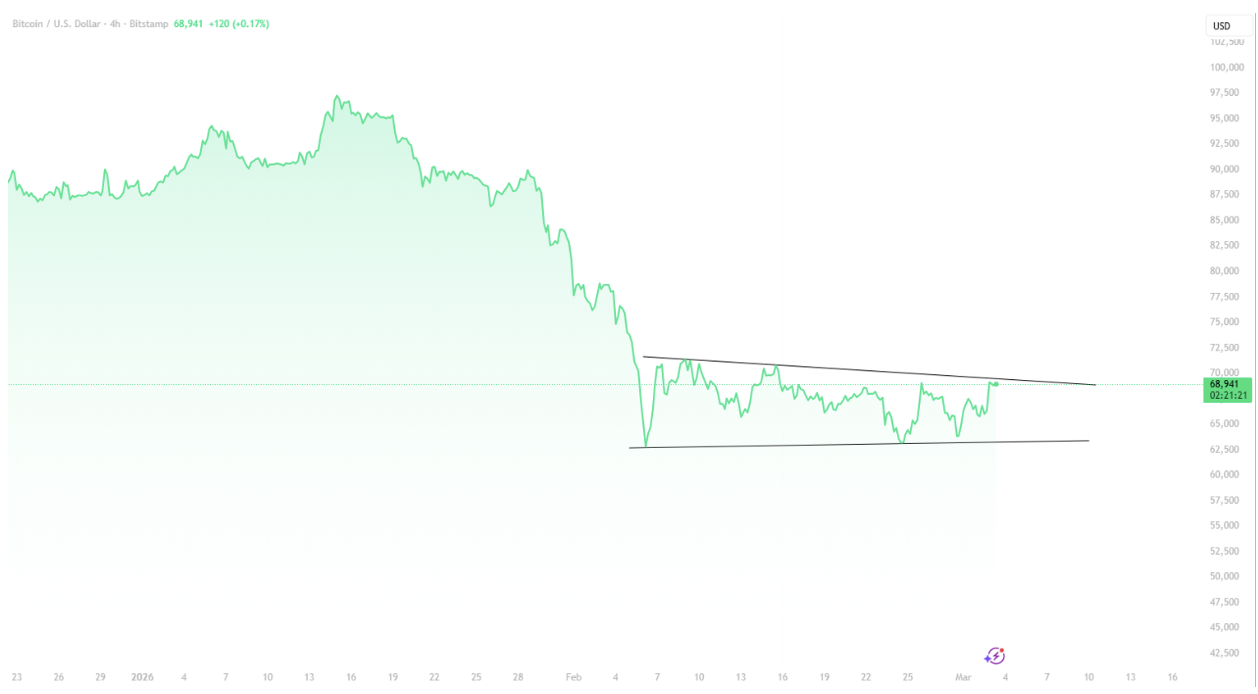
But zoom in on the chart and… we’re still stuck.
BTC is chopping inside a tight consolidation range. Price is coiling between roughly $62K and $70K since Feb 6th.
A sustained break above $70K would signal range expansion. Failure to hold current levels could bring $62K back into focus.
Right now, it’s compression.
Now here’s the important part.
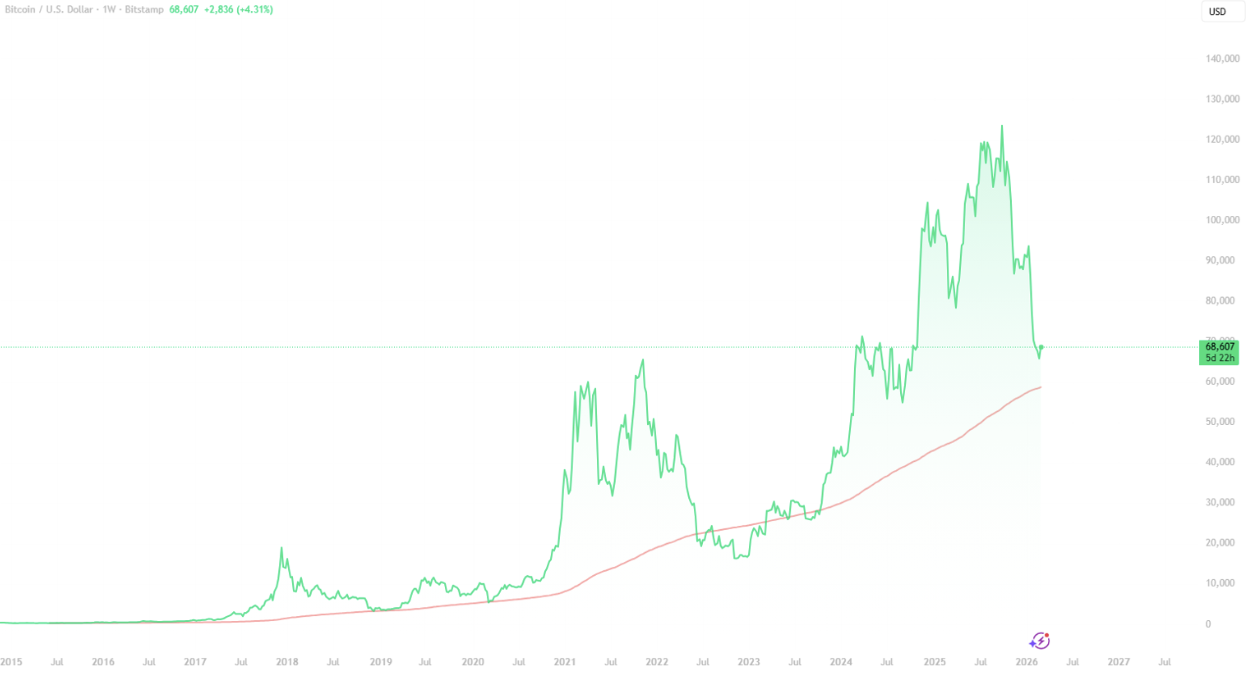
On the longer-term chart, Bitcoin is still holding above its 200 week moving average.
And this line is not just another indicator.
The 200 week MA has historically acted as Bitcoin’s structural floor.
Since 2015:
- Major cycle bottoms have formed around it.
- Deep bear markets have wicked into it.
- Sustained moves below it have been rare and short-lived.
In other words, when BTC is above the 200 week MA, the long-term structure is generally intact.
When it’s below, things get much more defensive.
Right now?
We’re still above it.
ETH
Ethereum is up 6.66% on the week. Quietly doing Ethereum things.
Let’s step away from ETH price action for a moment.
Vitalik Buterin recently signalled that Ethereum could be nearing a major shift toward full account abstraction, potentially enabled by EIP-8141.
In simple terms, wallets could become programmable.
Instead of basic key-controlled accounts, users could:
The proposal also introduces “paymasters,” which could allow users to pay gas in assets other than ETH or have applications sponsor fees directly.
Beyond usability, Buterin noted potential improvements to privacy and transaction processing at the protocol level.
If implemented, this would represent a significant structural evolution for Ethereum’s account model.
ALTCOINS
Altcoins haven’t exactly been chaotic lately.
For the most part, they’ve been moving with Bitcoin rather than against it. And that makes sense. A lot of alts already took their beating earlier in the year, so the recent BTC pullback hasn’t triggered the same kind of panic unwind.
One of the best ways to track this is through BTC Dominance (BTC.D).
BTC.D shows how much of the total crypto market cap belongs to Bitcoin versus everything else. Right now, BTC dominance is sitting around 58.98%.
That’s elevated.
For context, during the last true altcoin cycle before the 2022 bear market, BTC dominance dropped all the way to 39%.
We’re nowhere near that.
Since peaking in June 2025, BTC.D has been consolidating rather than breaking down. That tells us capital hasn’t rotated aggressively into alts yet.
Lets overlay BTC.D against Total 2 (Market Cap of all coins except BTC)
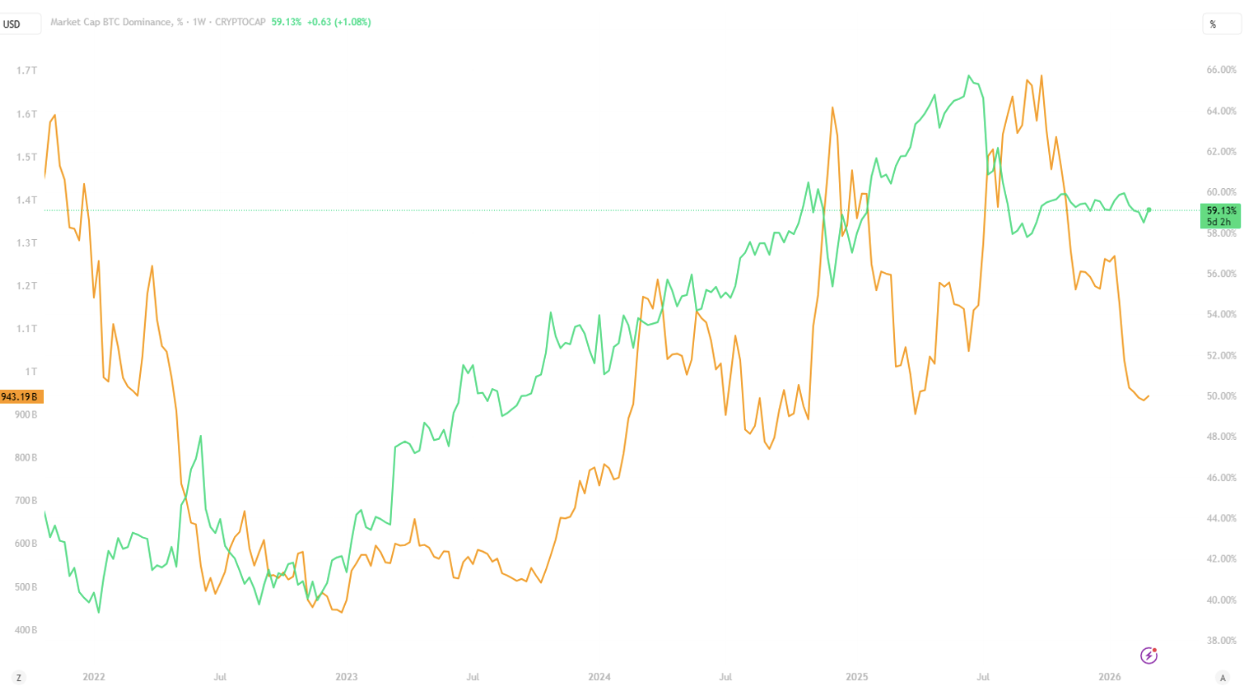
BTC.D rising + TOTAL2 falling → capital rotating into BTC
BTC.D falling + TOTAL2 rising → altcoins outperforming
Both rising → risk-on across the board
Both falling → risk-off / liquidity leaving crypto
NEAR
Remember we said we’re watching for gems outperforming BTC?
NEAR understood the assignment.
It’s up 46.91% this week and, more importantly, has broken out strongly against BTC on the chart. That relative strength is what we look for first.
Now the question becomes simple: can it hold momentum?
We can’t expect an up-only move like this forever. Breakouts usually need consolidation before continuation. The next few weeks will tell us whether this is sustained relative strength or just a sharp rotation spike.
Either way, it’s officially on the radar to watch.
There is a fundamental angle here as well.
NEAR just launched Near.com, a consumer wallet and super app designed to make crypto feel more like traditional finance. The aim is to remove friction. No juggling wallets. No switching chains. Just one streamlined interface.
The bigger play is AI.
Co-founder Illia Polosukhin is positioning NEAR as infrastructure for the coming “agentic era,” where AI systems do not just generate responses but transact and execute actions.
If AI agents become economic actors, they will need programmable payments and automated settlement. Near.com is designed to be that financial layer.
Price is reacting now.
Adoption is the next test.
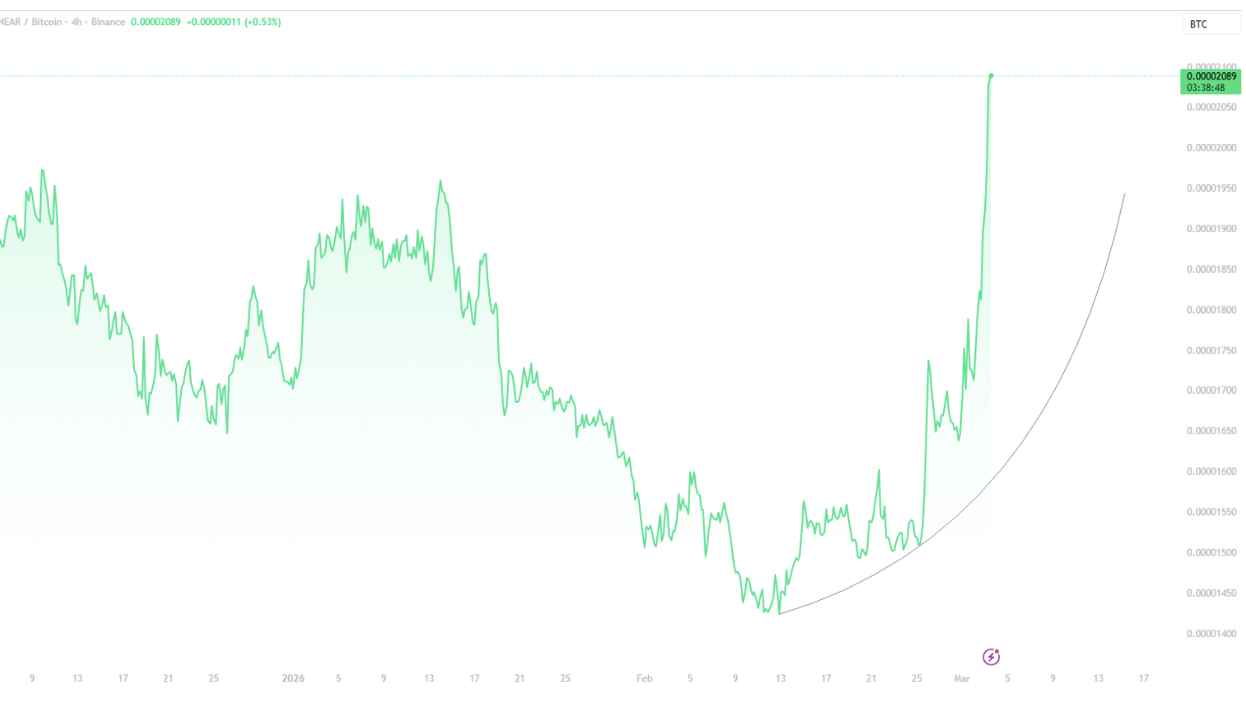
Source: Tradingview Near vs BTC
Real World Assets (RWA)
RWAs have quietly become one of crypto’s fastest growing sectors.
- Tokenised treasuries.
- Tokenised credit.
- Tokenised commodities.
- Even tokenised funds.
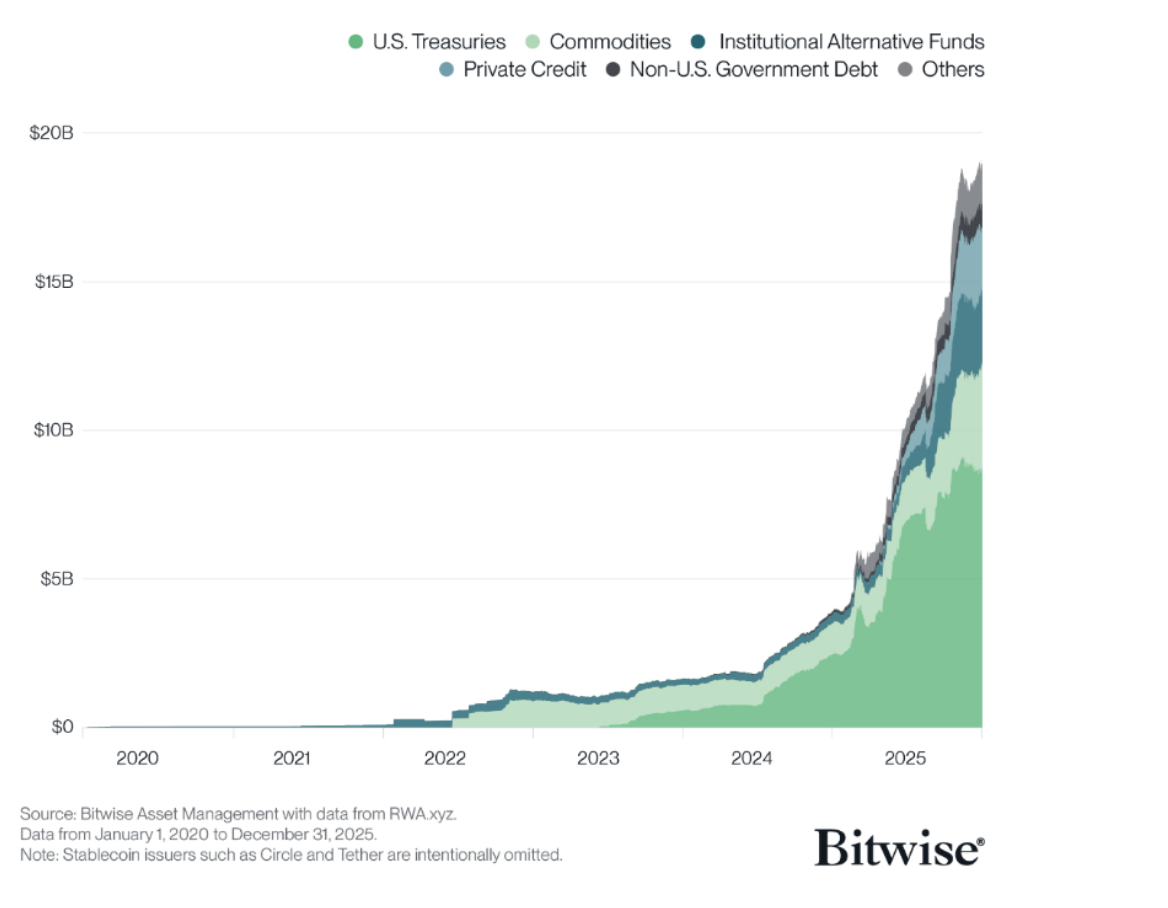
Source: Bitwise Asset Management
The chart highlights the shift clearly.
From 2020 to 2022, growth was relatively flat.
Since 2023, on chain real world assets have accelerated sharply and are now approaching 20 billion USD in value.
Large asset managers, including BlackRock, have publicly discussed expanding tokenisation initiatives across funds and traditional financial products. The direction is becoming clearer. More traditional assets are being issued or settled on blockchain rails.
Structurally, this means:
- Traditional finance experimenting with on chain settlement
- Faster clearing and improved transparency
- Capital markets testing blockchain based infrastructure
The shift from legacy settlement systems toward tokenised markets continues to build momentum, and the growth curve reflects that.


