

The Weekly Wrap
Over the last 7 days:
- Bitcoin (BTC) up 3.34%
- Ethereum (ETH) up 3.86%
- XRP up 3.06%
- Solana (SOL) up 2.11%
Other movers:
The total crypto market cap now sits at $2.36T, up 2.10% since last Wednesday.
Sentiment is still fragile. The Crypto Fear & Greed Index remains in Extreme Fear at 13, showing investors are cautious even as prices slowly recover.
ETF flows were one of the brighter spots this week.
Spot ETF flows: Bitcoin +$568.45M, Ethereum +$23.56M, Solana +$24.05M, XRP -$4.09M.
Macro:
Outside crypto, energy markets remain the key macro story.
The Iran conflict has created sharp swings in oil prices, increasing volatility across commodities. Rising energy prices can feed into inflation, which tightens financial conditions and can weigh on higher-risk assets like crypto. Almost everyone piled into long oil positions last week, only to see a violent reversal as headlines shifted in real time and crude flushed more than 20% in a single session.
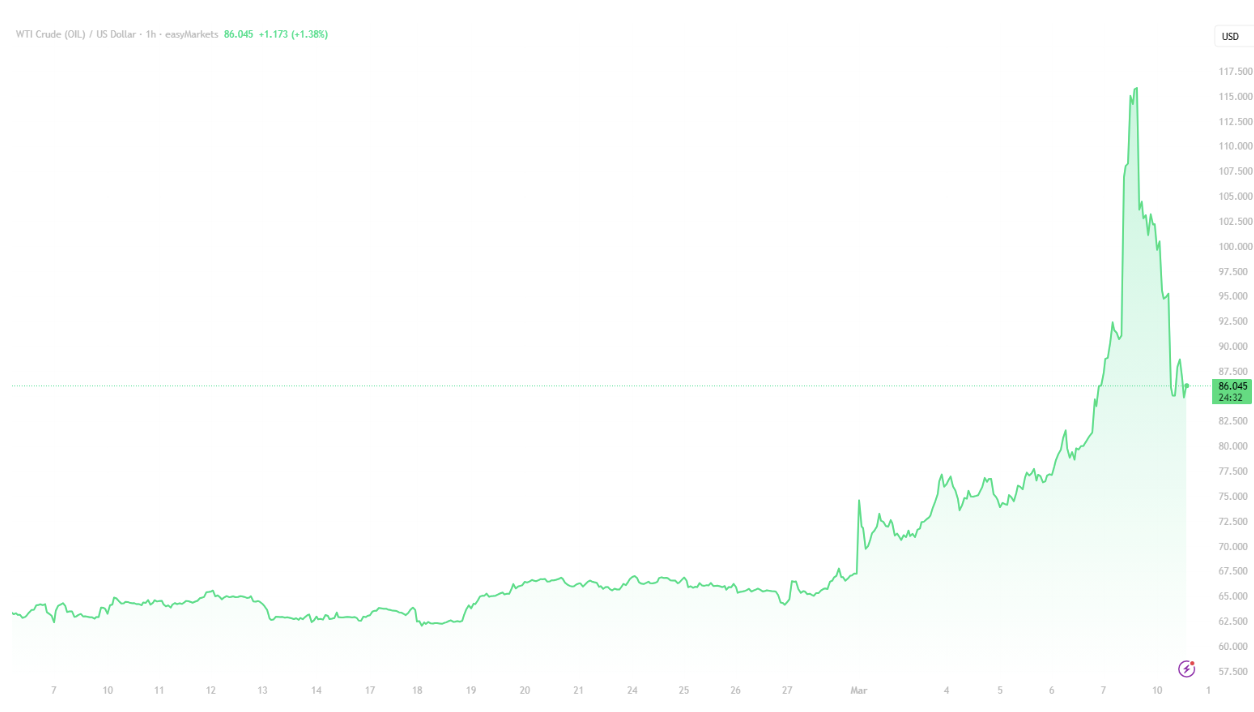
Source: Tradingview OILUSD
In Australia, the RBA lifted the official cash rate to 3.85% on February 3 after a 0.25% increase.
Markets are now watching the next RBA meeting on March 17, where interest rate futures imply roughly a 22% probability of another hike to 4.10%.
Globally, traders are focused on the U.S. CPI release on March 11, which will likely set the tone for bond yields, the U.S. dollar, and broader risk appetite heading into the next Federal Reserve meeting.
BTC
One macro chart worth watching compares Bitcoin to global M2 liquidity.
Global liquidity has historically shown a strong relationship with risk assets. When the global money supply expands, capital tends to flow into markets like tech and crypto.
Right now there’s a noticeable divergence.
Global M2 continues trending higher while Bitcoin pulled back earlier in the year, creating a gap between liquidity and price.
Historically these gaps don’t tend to persist for long. Either liquidity slows, or risk assets move higher to reconnect with the trend.
For now, liquidity conditions remain supportive in the background.
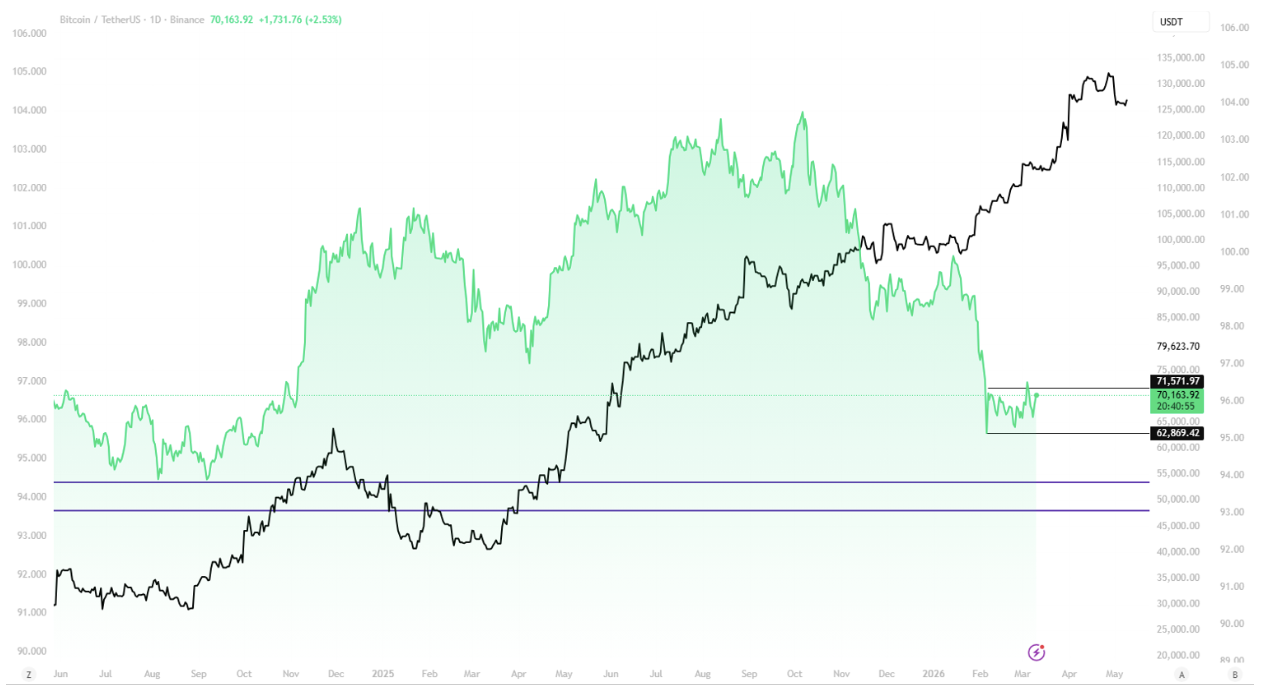
Source: Tradingview BTC vs M2 Global Liquidity 10 week lead
From a technical perspective, Bitcoin is still trading inside the same range we discussed last week.
Price briefly pushed above $71,571, but momentum faded quickly and BTC slipped back into the range. If bulls cannot reclaim and hold above the $71.5K level, the next area to watch sits closer to $62K.
For now, the market is still consolidating.
With ongoing geopolitical tensions in the background, short-term volatility is likely to remain elevated while traders wait for a clearer breakout direction.
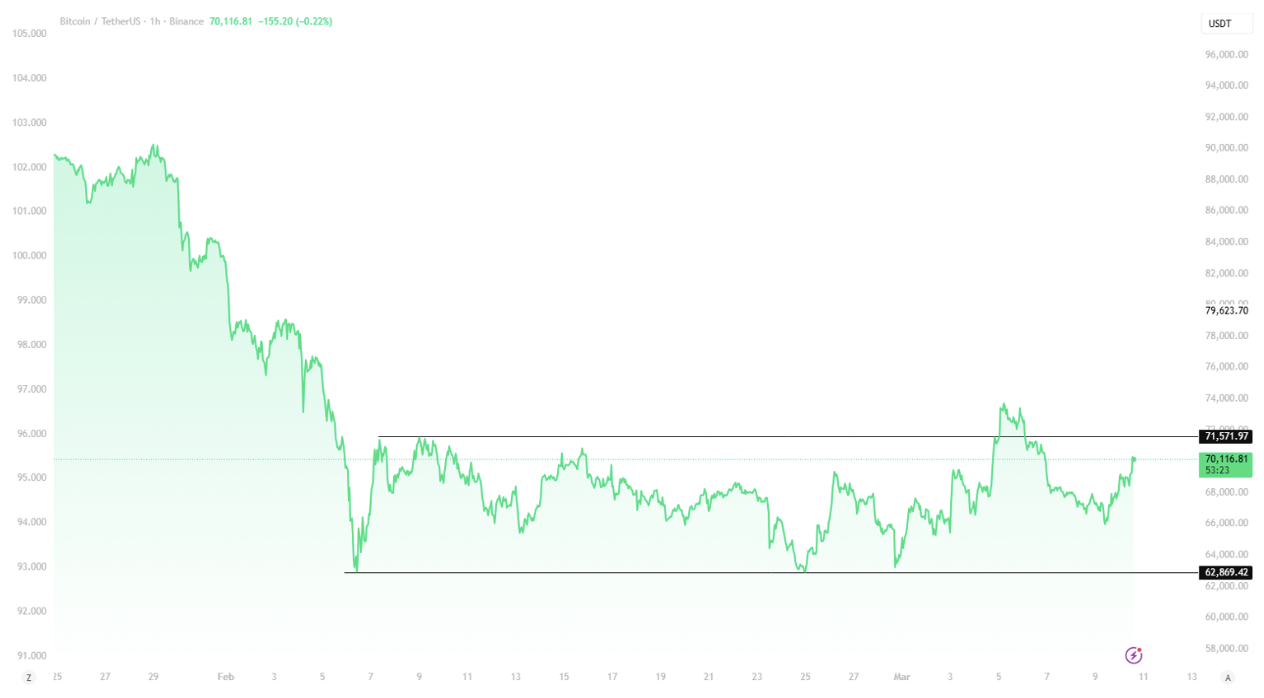
Source: Tradingview BTC/USD
Spot BTC ETFs pulled in roughly $568.45M in inflows over the past week, which is a clear improvement for sentiment. But inflows alone have not been enough to push price higher yet. The market has been stuck in a familiar pattern: flows increase while price remains choppy, which usually means there are still sellers sitting above the market.
ETH
Ethereum is up 3.86% over the past week, but the bigger story is consolidation.
On-chain activity has cooled slightly, with active addresses pulling back from recent highs as the network digests the earlier burst of activity.
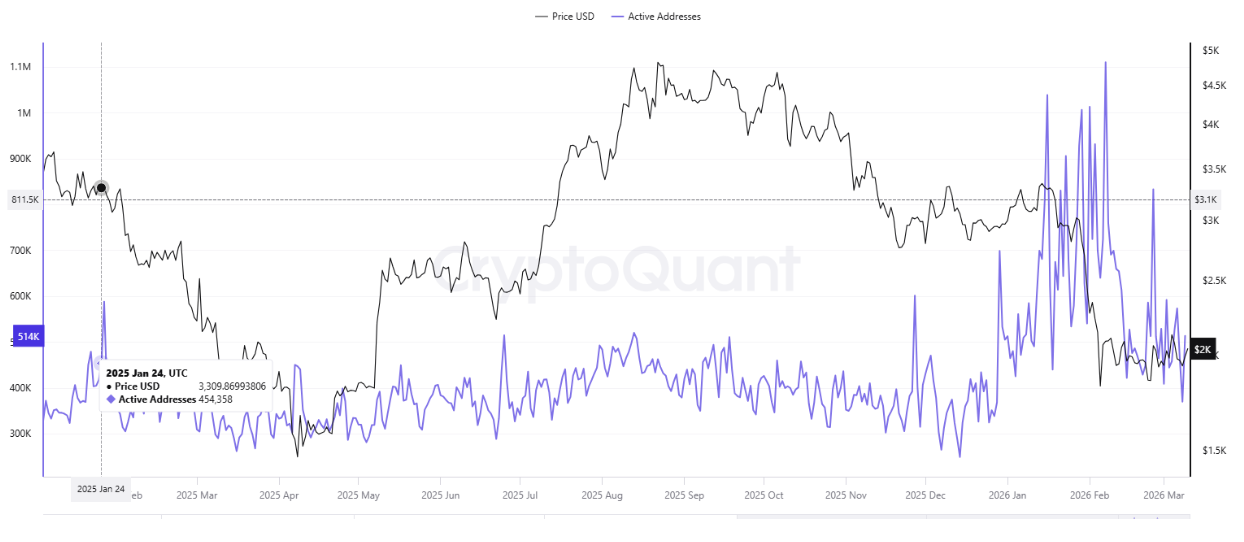
Source: CryptoQuant Active ETH addresses
Technically, ETH is sitting at an important level. Price is currently bouncing off the long-term support trendline that has held since the 2022 lows. The market briefly slipped below this structure during volatility earlier in 2025, but quickly reclaimed it.
For now, Ethereum is testing a key part of its cycle structure.If the trendline continues to hold, it may remain an important structural level for the market.
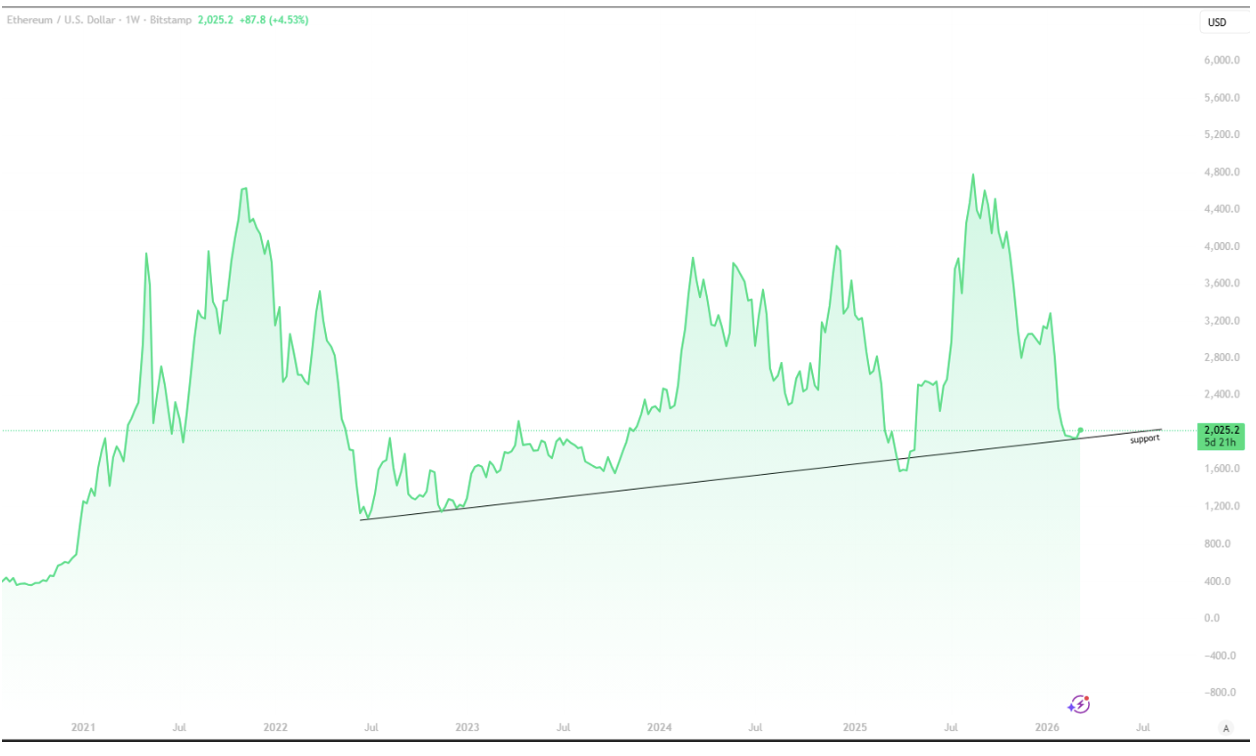
Source: Tradingview ETH/USD
ALTCOINS
Altcoins have actually held up better than Bitcoin so far in 2026.
Looking at the broader market, Gold is still leading the pack, up 21.16% on the year, while the NASDAQ has remained relatively flat, down about 1.60%.
Crypto has been the weaker side of the risk spectrum.
The total altcoin market cap (excluding the top 10) is down 14.39% year-to-date, while Bitcoin is down 21.31% over the same period.
What stands out is how closely the two have moved together. Altcoins have largely followed Bitcoin’s direction all year, just with slightly less downside pressure.
So while the market still feels heavy, the data suggests alts have quietly been absorbing the selloff better than BTC so far this year.
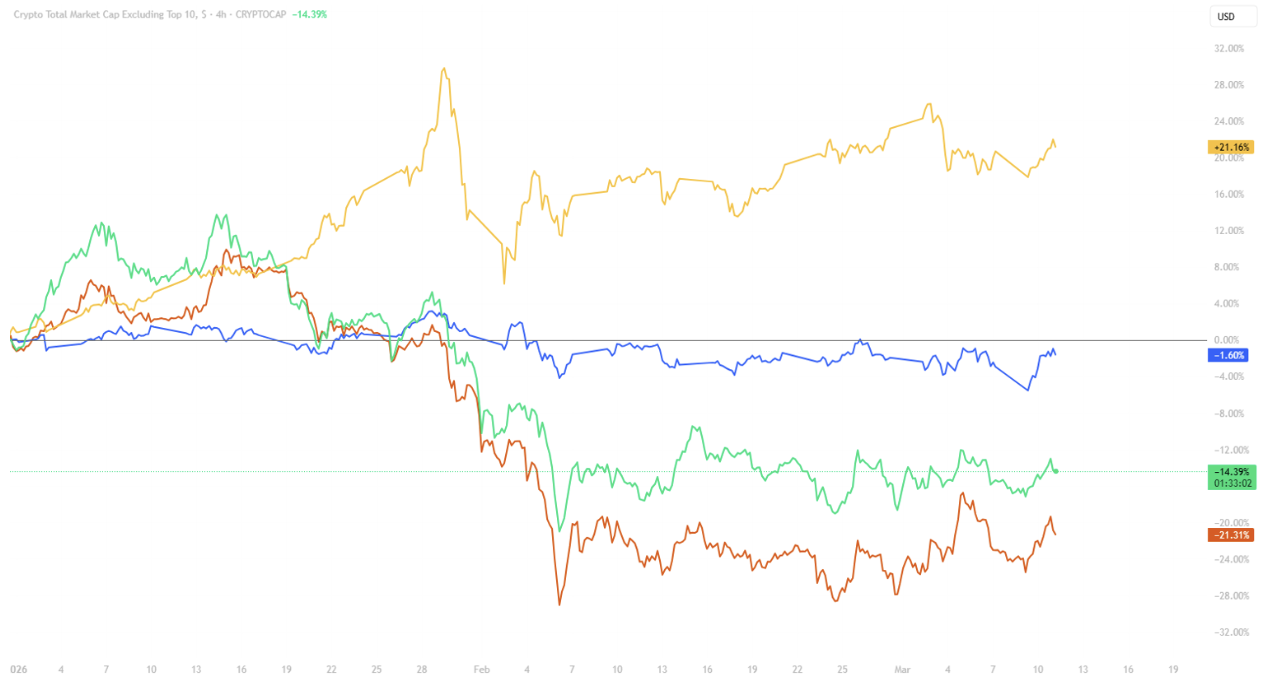
Source: Tradingview Total ex top10, GOLD, BTC, NASDAQ
CHZ
CHZ had a strong week, up 4.44%, continuing a trend that has been building since November.
On the CHZ/BTC chart, the token has been steadily outperforming Bitcoin, with price pushing into the upper range of its recent structure. Relative strength like this tends to stand out in quieter market conditions where most altcoins are simply following BTC.
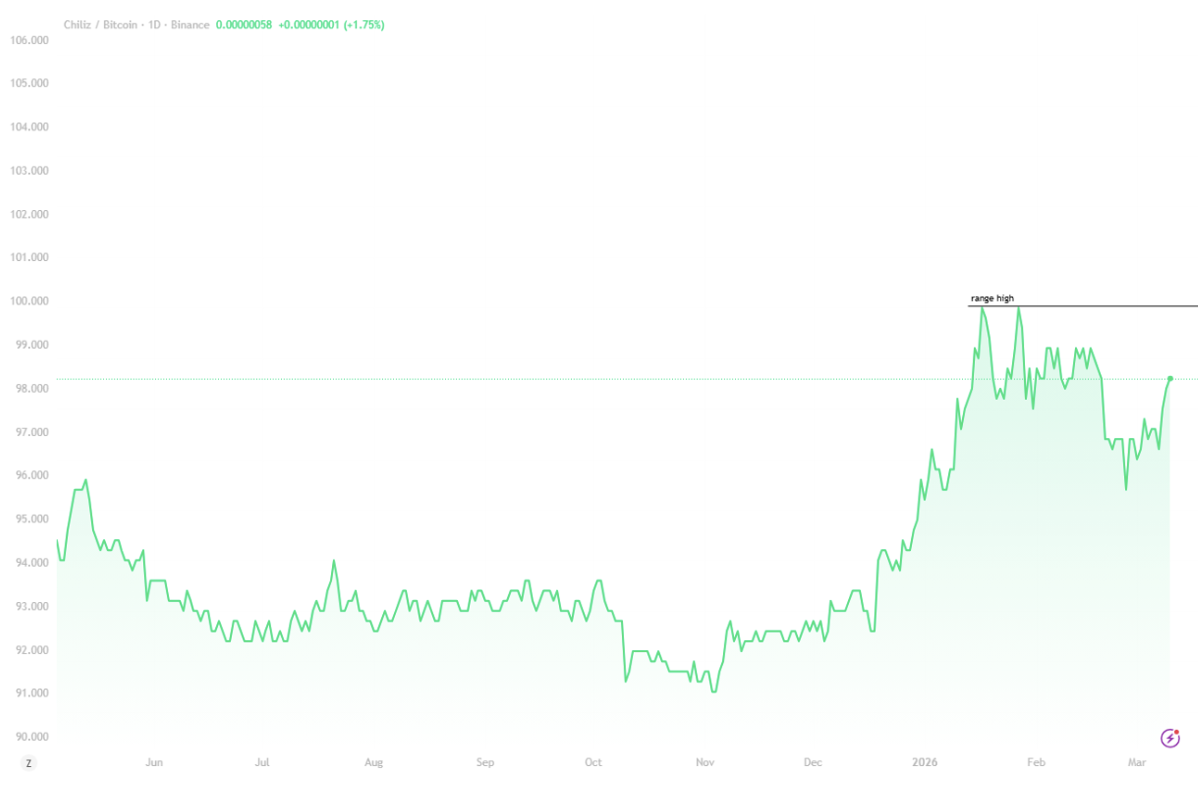
Source: Tradingview CHZ vs BTC
Part of the momentum may be tied to recent ecosystem developments.
Chiliz recently announced the launch of a prediction market on the Spicy Testnet, allowing users to speculate on the outcomes of sports and entertainment events directly within the ecosystem. The feature is designed to expand Chiliz’s fan engagement model beyond traditional fan tokens and into interactive on-chain markets.
For now, CHZ remains one of the altcoins showing relative strength against BTC, and the next step will be seeing whether it can hold momentum after the current consolidation.
ETHFI
EtherFi saw renewed attention this week after ETHZilla, a Nasdaq-listed Ethereum treasury company backed by Peter Thiel, announced a $100M allocation into the protocol.
The move highlights growing institutional interest in liquid restaking, where users can earn additional yield on staked ETH while helping secure the Ethereum network.
The sector has expanded rapidly, with over $30B now locked across restaking protocols, with EtherFi currently leading by total value locked.
Stablecoins (USDT, AUDF)
Stablecoins are still one of the biggest themes heading into 2026.
Total stablecoin market cap now sits around $314.2B, making up roughly 12–13% of the entire crypto market. That’s a huge pool of capital acting as crypto’s liquidity layer.
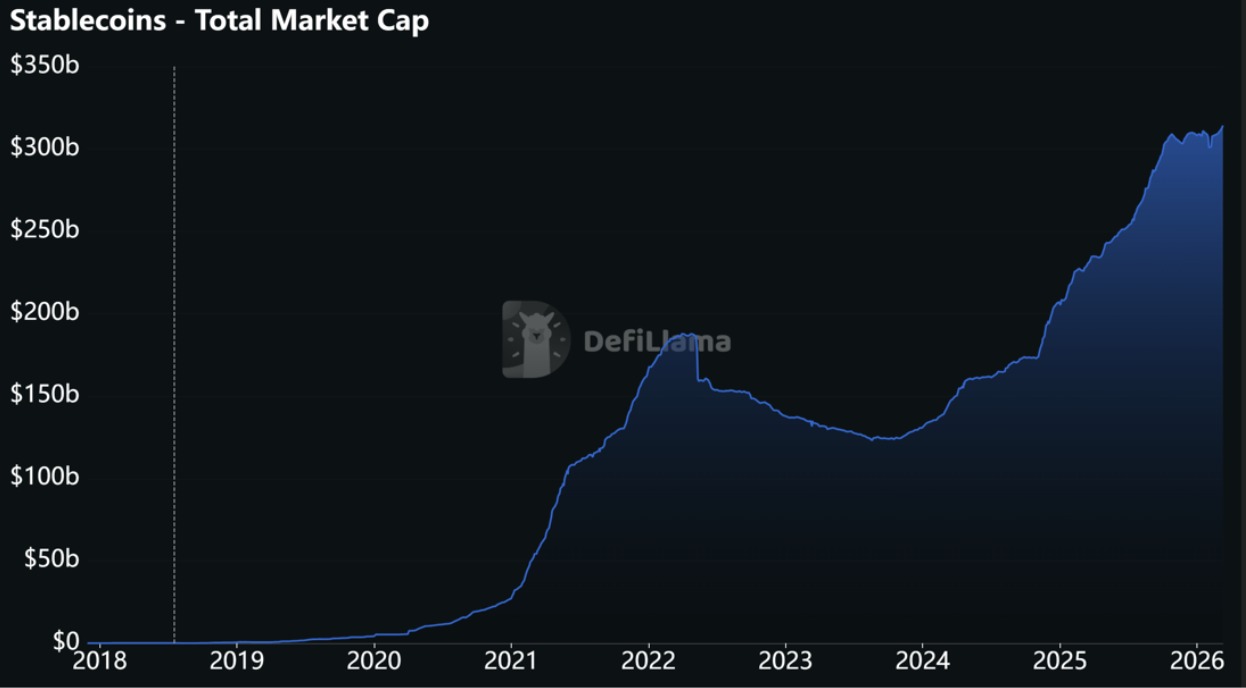
Source: DefiLama Stablecoins Total Market Cap
But the bigger story isn’t just size. It’s the mainstream adoption.
Stablecoins are quietly becoming one of the main bridges between crypto and traditional finance. Over the past few weeks, companies like Visa and Stripe have pushed further into stablecoin payment infrastructure, allowing users to spend stablecoins through familiar card networks across multiple countries.
That’s a big shift.
Instead of stablecoins living mostly inside exchanges, they’re starting to plug directly into everyday payment rails. If that trend continues, it could become one of the biggest long-term demand drivers for the sector.
On the regulatory side, the market is still watching developments around the CLARITY Act in the United States. Progress has been slower than expected, though recent reporting suggests the delays may be tied to broader regulatory coordination rather than disagreements around stablecoin yield.


