The Weekly Wrap
Since last week’s wrap, the total crypto market cap has stabilised, now sitting at $2.34T, up 1.07% over the past 7 days after finding a local low near $2.05T on February 6.
Sentiment hasn’t improved much. The Fear & Greed Index remains deep in “extreme fear,” hovering around 10, showing risk appetite is still thin.
Bitcoin ETFs also extended their cold streak, recording $359M in outflows, marking the fourth consecutive week of net redemptions.
On the macro side, last week’s U.S. CPI data came in softer than expected, with annual inflation easing to 2.4% from 2.7% previously. Bond yields pulled back as markets began pricing in a higher probability of future rate cuts. Historically, easier policy expectations tend to support risk assets, though so far, crypto has yet to meaningfully respond.
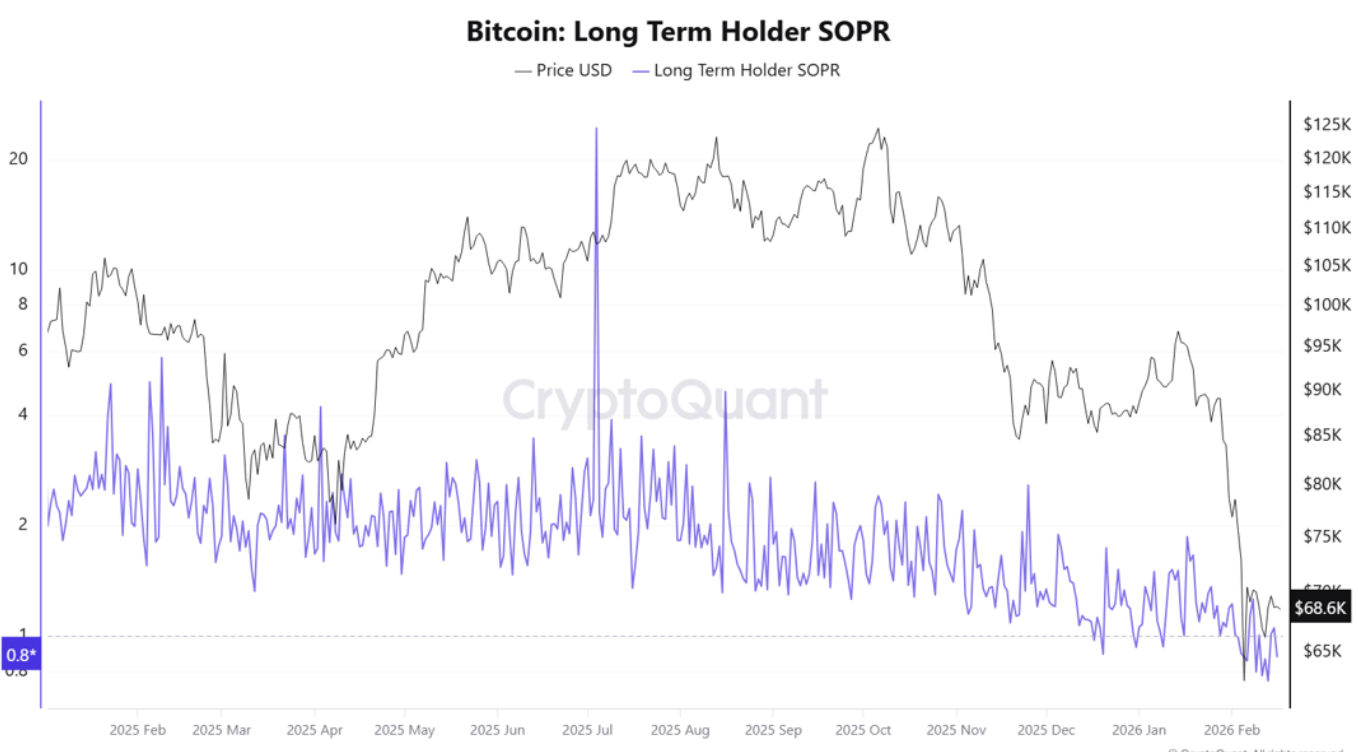
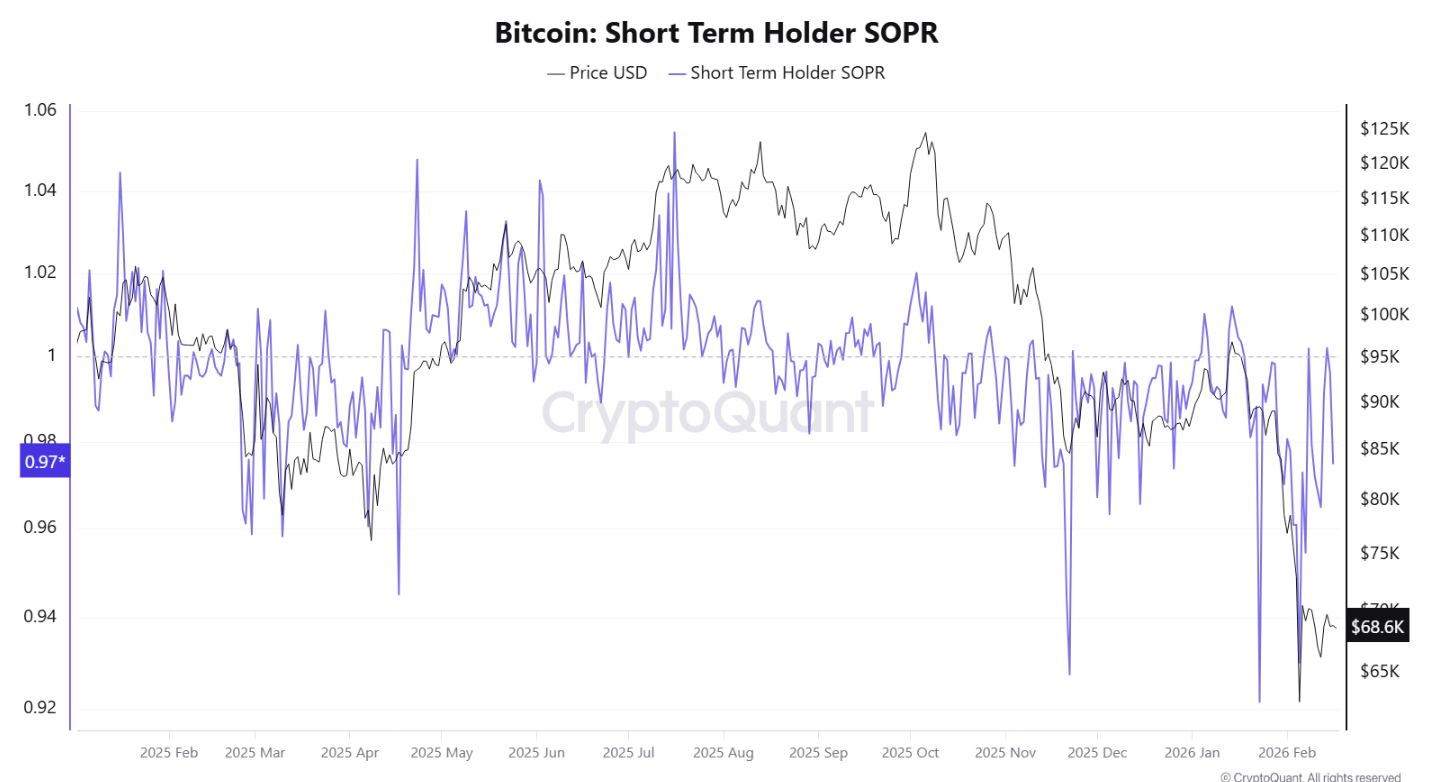
Looking at the charts below, Short-term holders are already underwater.
Now long-term holders have dipped below 1 too, with Long Term Holders (LTH) SOPR sitting around 0.8. That means even coins held for over 155 days are being sold at a loss.
That’s not common.
Long-term holders usually sell into strength, not weakness. When they start realising losses, it typically signals broad stress across the market rather than simple short-term volatility.
In past cycles, deep drops in LTH SOPR have tended to show up during heavy corrections or late-stage shakeouts. Right now, both short-term and long-term participants are selling below cost basis. That tells you one thing clearly.
Pressure is not isolated.
Source: https://cryptoquant.com/
Over the last 7 days:
- Bitcoin (BTC) down 1.56%
- Ethereum (ETH) down 2.32%
- XRP up 2.87%
- Solana (SOL) up 2.21%
Other movers:
BTC
Bitcoin is in the red again, down 1.56% over the past seven days. Monday’s close marked four straight red weekly candles, keeping short-term momentum soft.
In derivatives, funding rates have flipped negative, which means short positions are now dominant. Traders are leaning bearish rather than aggressively long.
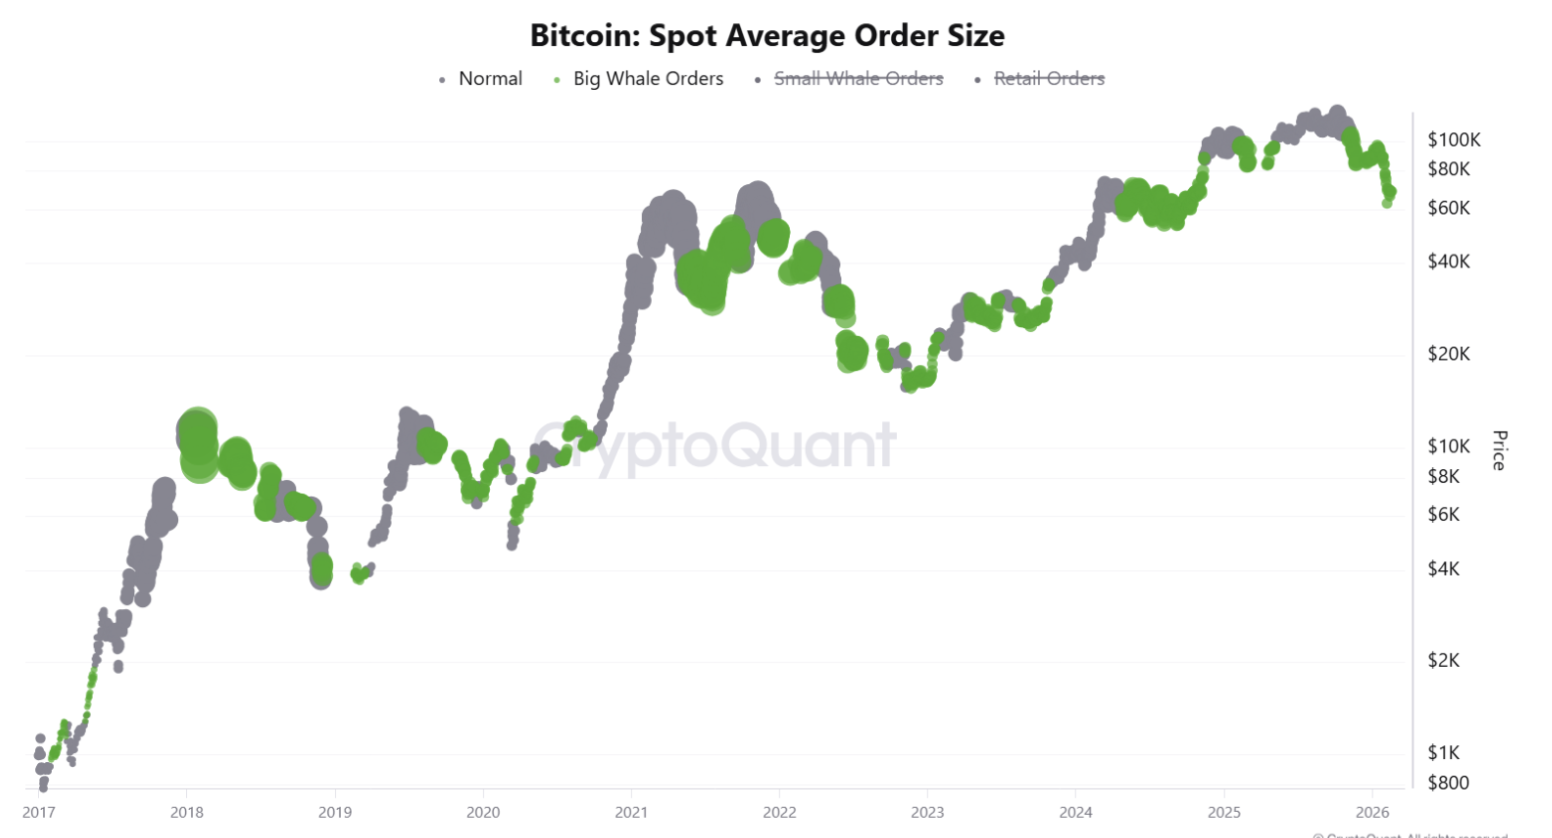
Zooming out to whale activity, the chart shows large order clusters appearing again near current levels. Historically, elevated whale participation tends to show up around major inflection points, not quiet trends.
That does not tell us direction on its own. Whales can accumulate, distribute, hedge, or reposition.
But one thing is clear. Bigger players are active again and when they step in, volatility usually follows.
ETH
Ethereum has slipped another 2.32% over the past seven days and now sits roughly 60% below its August all-time high.
From a structural standpoint, price is drifting back toward prior 2025 levels. The next major historical support sits near the April 2025 lows around US$1,384, which would represent a 30% retrace from current levels if tested.
On the flows side, spot ETH ETFs recorded US$161.15M in outflows last week, reflecting continued near-term pressure in institutional vehicles.
That said, access continues to expand. Morgan Stanley recently added an Ethereum Trust to its planned crypto ETF lineup, keeping ETH firmly on institutional radars even as short-term flows remain soft.
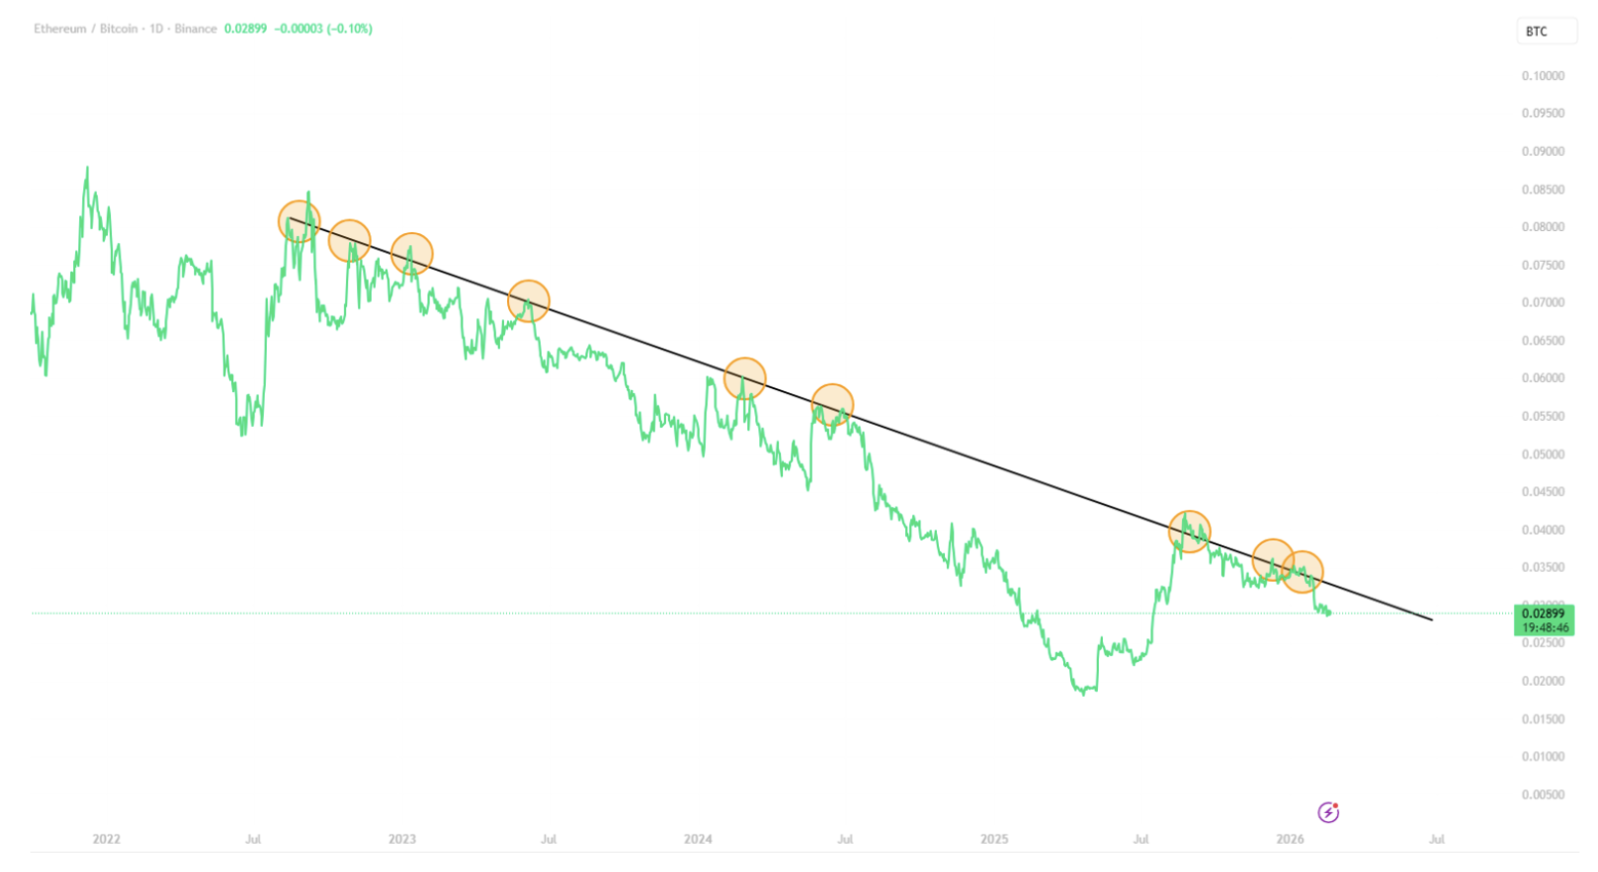
Zooming out to the ETH/BTC chart (below), the relative trend remains intact. Ethereum once again rejected from its long-term descending resistance line, marking another lower high against Bitcoin. Until that structure breaks, BTC continues to lead on a relative basis.
In short: price is under pressure, ETF flows are negative, but distribution channels are still widening.
ALTCOINS
SOL
Solana’s narrative is maturing.
Builders told CoinDesk the next chapter is about infrastructure and real-world finance, not just memecoins. The founder has also pointed out that stablecoins are exposing inefficiencies in traditional banking, reinforcing Solana’s push to position itself as high-speed settlement rails.
On the roadmap, the upcoming Alpenglow upgrade aims to improve transaction finality and network reliability, targeting faster confirmations at scale.
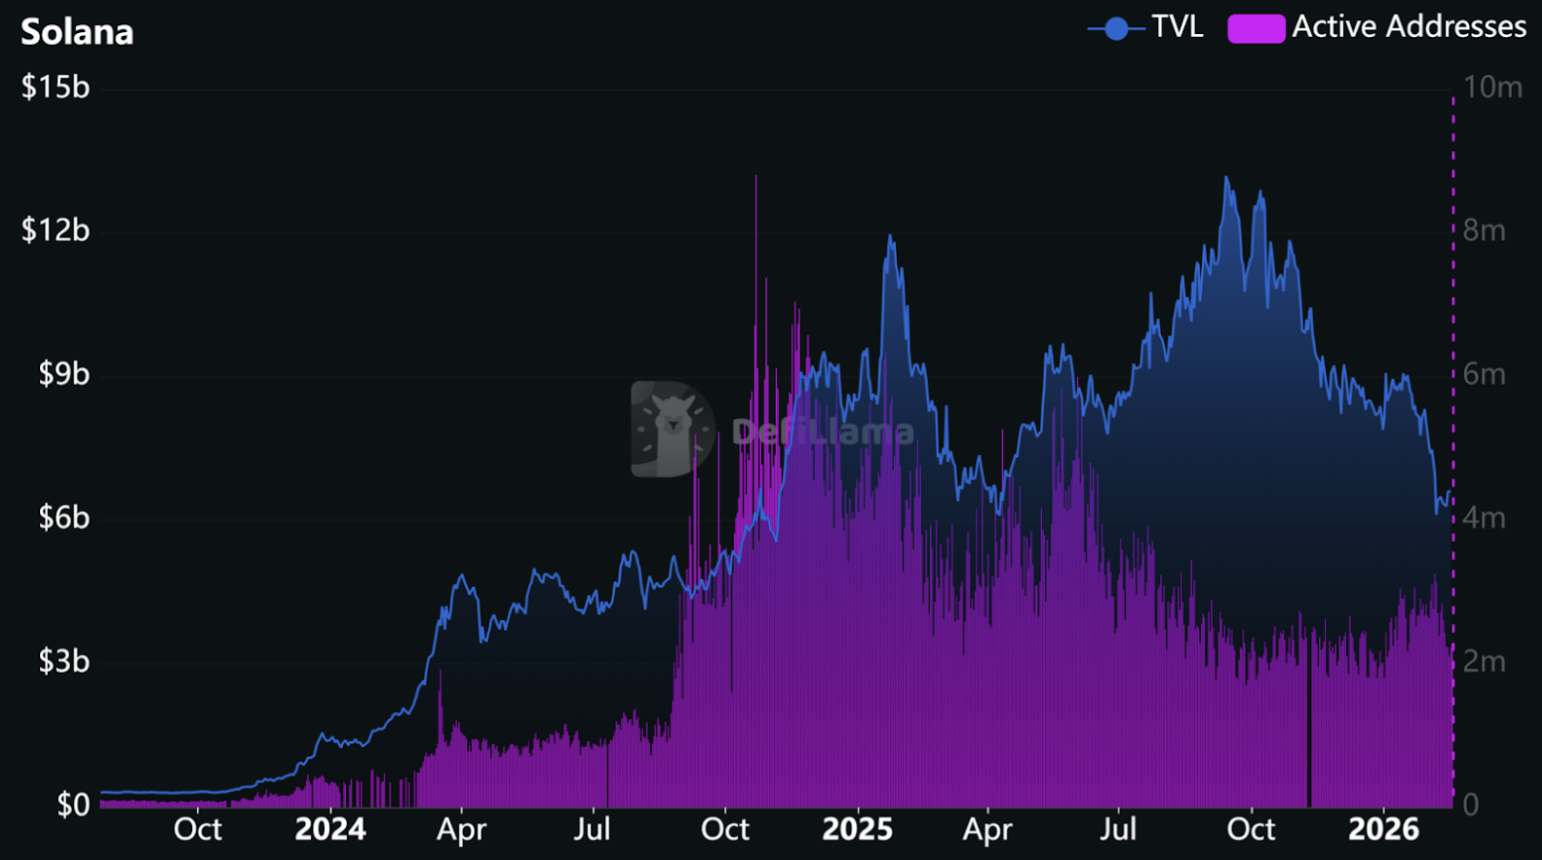
Onchain, TVL has cooled from roughly US$13B to around US$6B.
TVL, or Total Value Locked, measures how much capital is deposited across DeFi protocols on a network. It’s often used as a proxy for capital commitment.
While TVL is well below peak levels, active addresses are consolidating rather than collapsing, suggesting steadier usage even as capital has rotated out from prior highs.
PEPE, AAVE, POL
PEPE, AAVE and POL are having strong weeks.
PEPE is up 19.7%, AAVE 16.3%, and POL 20%, all outperforming BTC. That’s notable given broader market hesitation.
AAVE and POL are holding up well even as progress on the Clarity Act faces delays, showing that regulatory headlines are not the only driver of momentum right now.
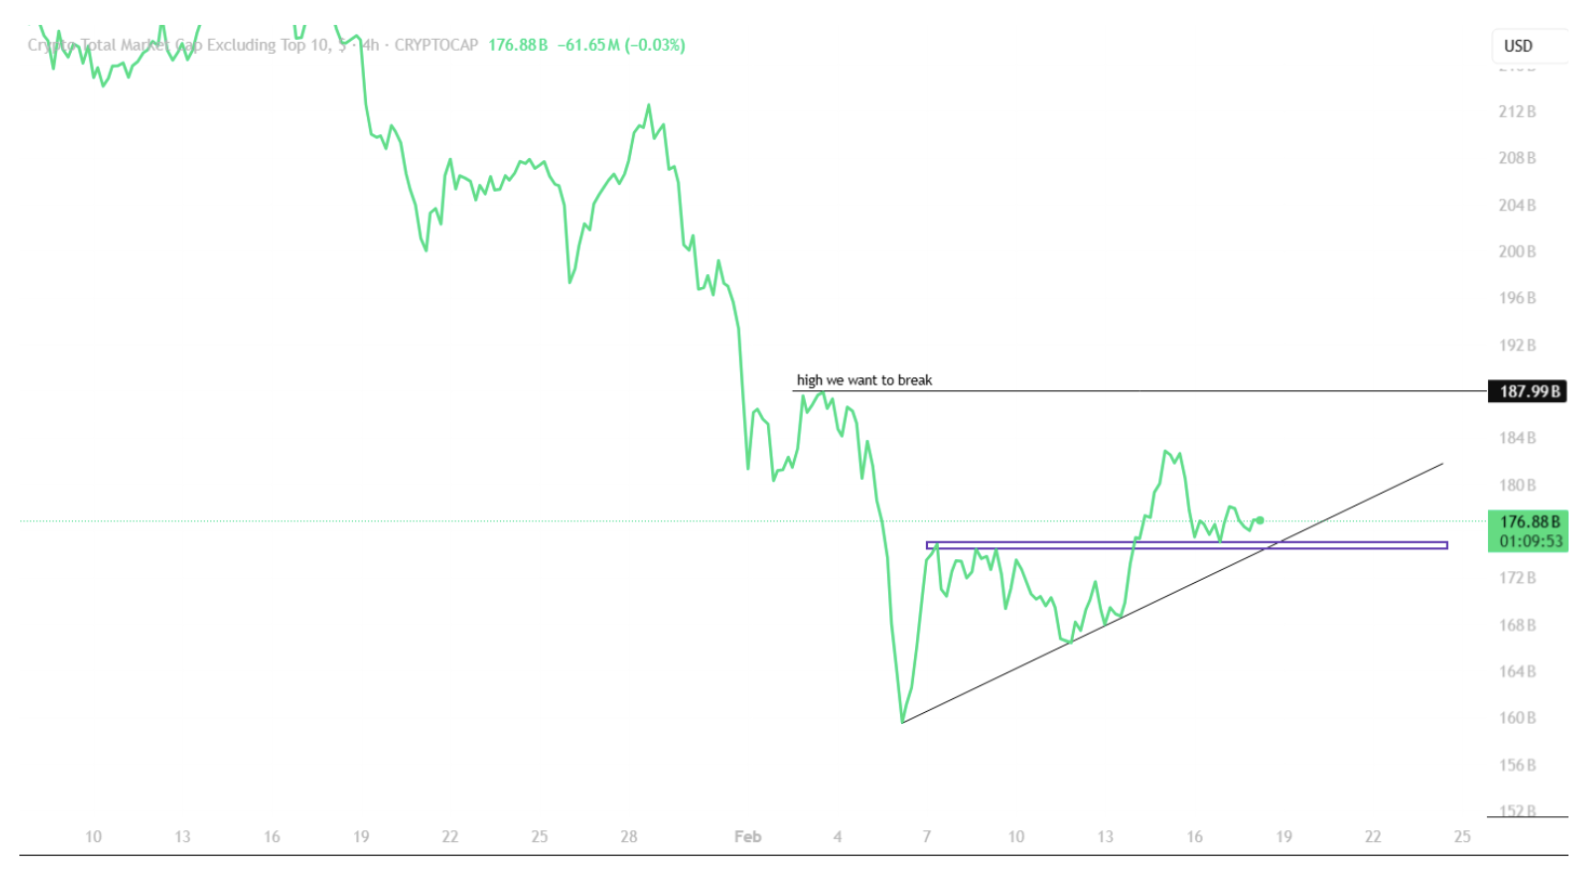
Zooming out, the Total Market Cap excluding the top 10 coins has broken its short-term downtrend that started in late January. Since February 6, alts have shown steady upward momentum.
The next key level sits around US$187B. A clean break above that would mark a higher high. If rejected, the range support below sits closer to the US$160B area.
STABLECOINS (USDT, AUDF)
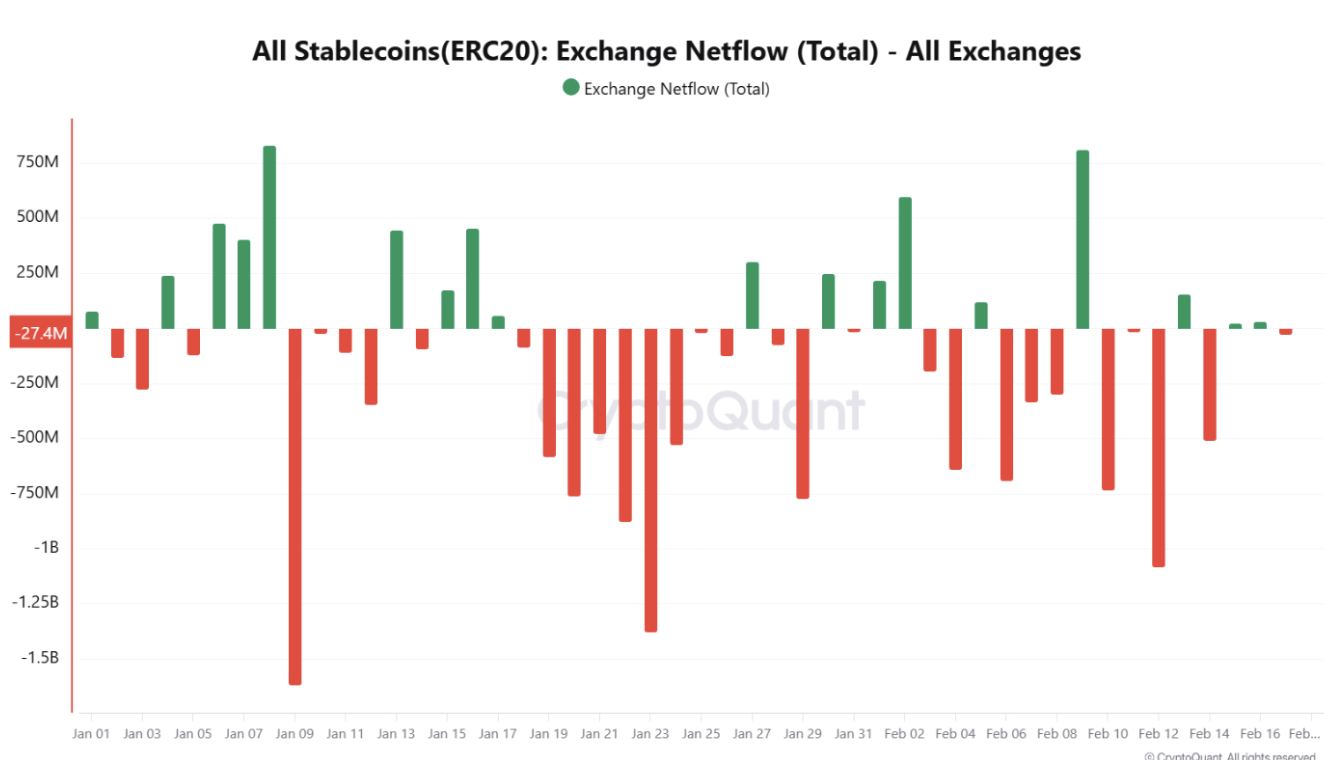
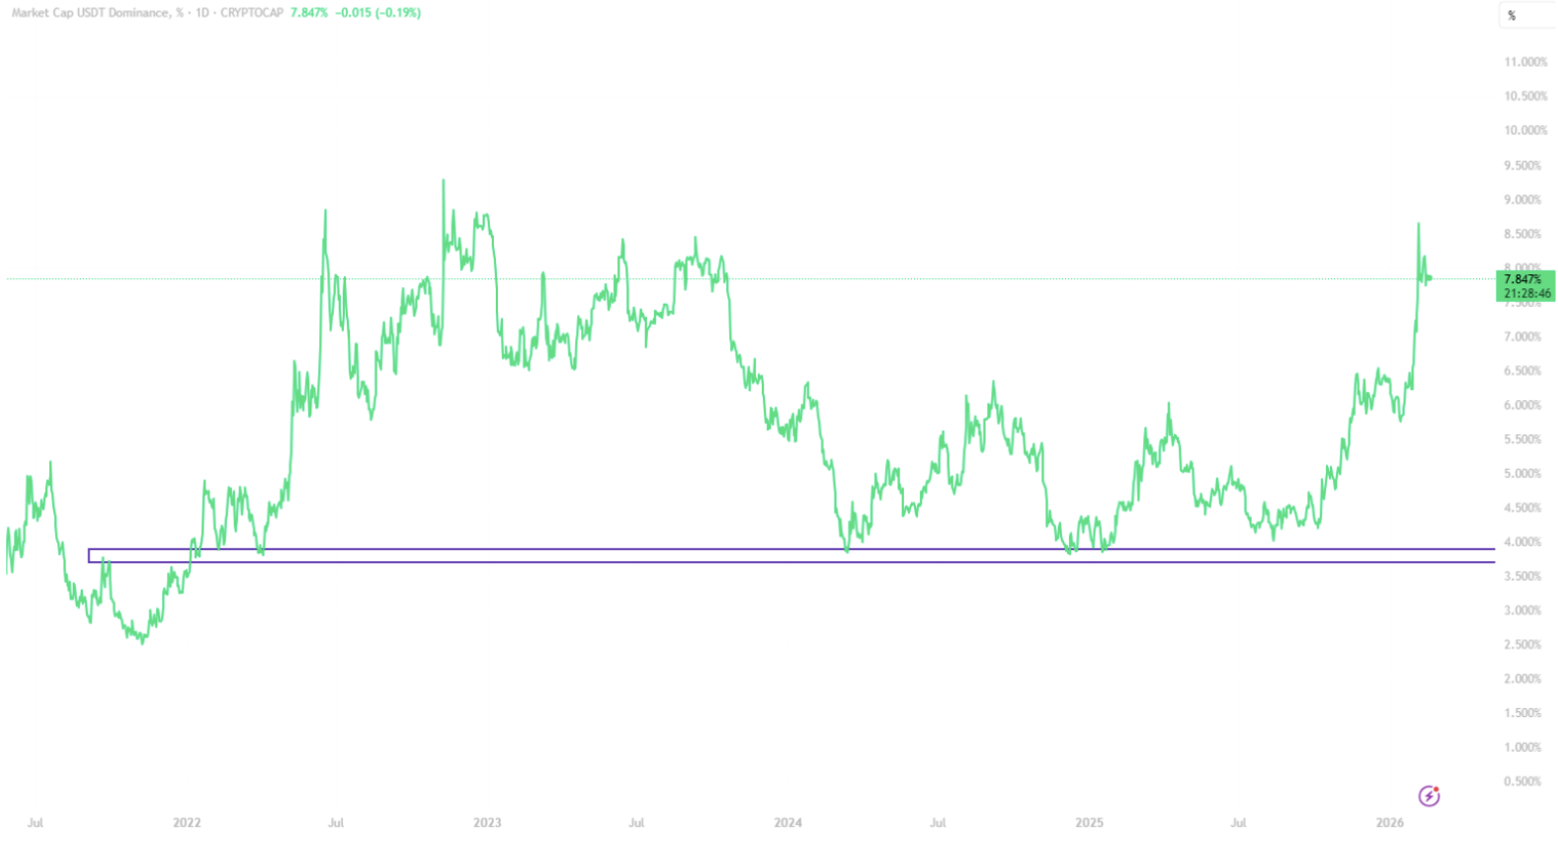
Let’s talk USDT dominance.
USDT dominance has pushed higher recently, meaning a larger share of total crypto market cap is sitting in Tether. When dominance rises, it usually signals capital rotating out of risk and into sidelines.
In simple terms: more people are holding dry powder instead of deploying it.
Now look at exchange netflows.
Stablecoin netflows have mostly been negative through 2025, meaning more stablecoins are leaving exchanges than entering. That can mean a few things:
- Profits being taken and moved off-platform
- Capital sitting idle in self-custody
- Reduced immediate buying pressure
When stables sit off exchanges, it often reflects caution rather than aggression.
Right now, stablecoin data suggests positioning is defensive, not euphoric.