

The Weekly Wrap
Over the last 7 days:
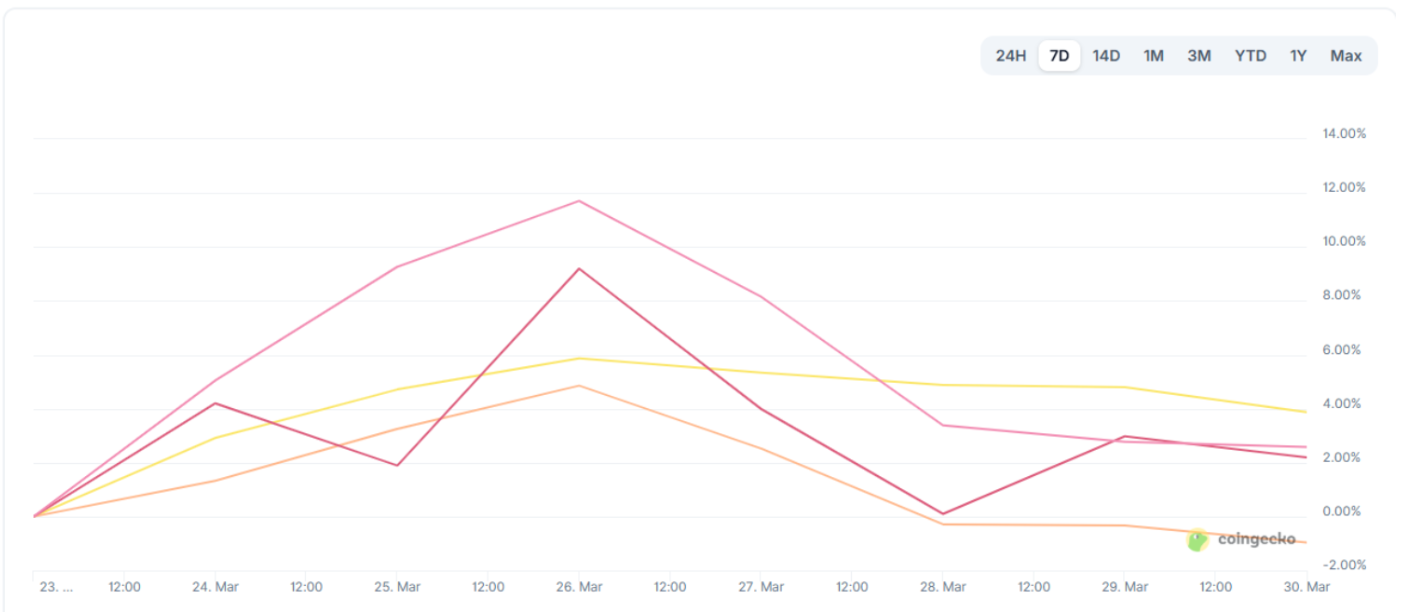
- Bitcoin (BTC) down 2.38%
- Ethereum (ETH) down 1.70%
- XRP down 4.18%
- Solana (SOL) down 6.03%
Other movers:
Total crypto market cap fell 3.34% this week, sitting around $2.32T at the time of writing. ETF flows turned negative again:
- BTC: -$296.18M (total net assets: $84.77B)
- ETH: -$206.58M (total net assets: $11.32B)
Sentiment has taken a hit again. The Fear & Greed Index has dropped to 8, firmly in extreme fear territory, as geopolitical developments continue to weigh on markets.
Looking at the broader market:
🟡 Gold: +2.67% YTD
🔵 NASDAQ: -9.37% YTD
🟢 Bitcoin: -23.61% YTD
Gold has managed to flip back into positive territory after a sharp pullback last week, showing some resilience despite recent volatility. Meanwhile, equities continue to struggle. The NASDAQ is now down over 9%, reflecting a broader risk-off move across markets.
Bitcoin remains the weakest of the three, sitting down over 23% on the year, still feeling the impact of the wider sell-off and reduced risk appetite.

Source: Tradingview, BTC, GOLD, NASDAQ
Macro: Aussie Fuel Watch
The broader market has remained choppy, with short-term volatility continuing to be driven by recent geopolitical developments. Oil has followed suit, holding onto its strength after the sharp spike earlier in March and continuing to trade higher alongside fuel prices.
The chart below shows oil now sitting around $100 USD, right at the top of its current range. This is a key level, with price yet to break out meaningfully in either direction.
With ongoing geopolitical tension and growing commentary around supply risks, including Trump stating the US will “take the oil”, it will be worth watching whether oil pushes back toward recent highs or continues to consolidate as uncertainty persists. But the impact of this region goes beyond energy.
The Strait of Hormuz handles roughly 21% of global oil and LNG flows, but it is also a critical route for global agriculture. Around 30–35% of traded nitrogen-based fertilizers pass through this same chokepoint. If disruptions persist, it is not just energy markets that may be affected. Fertilizer supply constraints can flow through to higher crop prices and increased pressure on global food supply chains, particularly in import-dependent regions.
For now, markets are reacting to headlines. But the broader implications sit across energy, agriculture, and global supply chains.

Source: Tradingview OIL/USD
BTC - Bitcoin
Bitcoin is down 2.38% at the time of writing and still stuck in sideways chop. There are two classic ways to enter the market:
- Go all in at once (lump sum)
- Or spread it out over time (DCA)
Simple enough, but the outcomes can look very different. Lump sum is all about timing and if you get a good entry, returns can stack quickly. If you don’t, you wear the full drawdown.
DCA flips that. Instead of trying to pick the perfect moment, you buy consistently over time, smoothing out volatility and removing the need to “get it right” on day one.
- In choppy or declining markets, DCA has historically reduced timing risk by spreading entry points.
- In strong uptrends, lump sum approaches have historically captured more of the move earlier.

Source: bitview.space
BUY BTC
ETH - Ethereum
ETH is back at a familiar spot.
On the ETH/BTC chart, we’re once again testing that multi-year downtrend line that has rejected price again and again over the past 4 years.
This level has acted as a key area of resistance. A move above this level may shift momentum across the alt market. Reject again and the broader downtrend remains intact.
For now, we watch.

Source: Tradingview ETH VS BTC
The Ethereum Foundation just staked 15,000 ETH ($46M AUD) in its largest move to date. This does a few things:
- Strengthens network security
- Generates yield instead of idle treasury holdings
- Signals a longer-term commitment rather than selling pressure
At the same time, institutional products continue to evolve.
BlackRock recently launched a staking-enabled ETH ETF (ETHB), combining price exposure with staking rewards. Early flows have been positive, and more broadly, demand for crypto ETFs remains heavily concentrated in Bitcoin and Ethereum. Ethereum just posted record network usage, yet price struggled.
That disconnect came down to a few things:
- Heavy liquidations earlier in the quarter
- Capital rotating into macro trades like oil and gold
- Activity shifting to layer 2s, reducing base layer fee burn
So while usage is strong, price has been driven more by flows than fundamentals in the short term.
BUY ETH
ALTCOINS
Altcoins stayed steady over the past 7 days. Earlier in the week, momentum picked up across most sectors before fading into the weekend, with gains cooling off across the board.
- RWA led the way, up 3.87%
- Memecoins followed at +2.19%
- AI held steady with +2.58%
- DeFi lagged slightly, down 0.96%
Source: Coingecko categories
SUI
With SUI going live on Cointree this week, it’s a good time to take a look at what’s been happening across the ecosystem. One of the bigger developments has come from the institutional side.
As of early 2026, SUI already has spot ETFs that include staking rewards live in the market, with products like Canary Capital’s SUIS on Nasdaq and Grayscale’s GSUI on NYSE Arca. These funds provide exposure to SUI while also capturing staking yield, which is reflected in the fund’s NAV.
SUI saw staking-enabled ETFs reach the market ahead of Ethereum, highlighting how quickly newer Layer 1s are being explored by traditional finance. More recently, 21Shares has also launched a spot SUI ETF, adding to the growing list of institutional access points.
On the ecosystem side, Sui is continuing to expand into DeFi. The network has introduced USDsui, a native stablecoin designed to support on-chain liquidity, while projects like Hashi are building out additional DeFi functionality on the network. Taken together, the trend is clear.
Sui is building across institutional access, liquidity, and developer activity.
Sui Price Action
SUI has been moving in line with the broader market, trading sideways since early February. Price is currently holding a clear support zone around $0.84, with multiple tests of this level so far. This kind of repeated interaction often highlights an area where buyers have stepped in.
For now, SUI remains range-bound, with no strong directional move yet. One level worth noting:
SUI has yet to revisit the large liquidation wick from October 10, a move that saw sharp downside volatility across the market at the time. These types of wicks can sometimes act as areas of interest if price rotates back toward them. For now, price action remains contained within the current range, with focus on whether support continues to hold or the range expands.

Source: Tradingview SUI/USDT
BUY SUI
Chart of the Week
Everyone wants to catch the bottom. Almost no one actually does. But we can prepare.
One chart that’s quietly held up over multiple cycles is Bitcoin’s cost of production. This tracks the average cost for miners to produce one BTC, and historically, price tends to gravitate toward this level during major drawdowns. You can see it clearly on the chart. Each time price taps that zone, it lines up with key accumulation periods rather than prolonged downside. It doesn’t call exact bottoms, but it highlights where selling pressure starts to dry up and the market begins to reset.

Source: Tradingview BTC Cost of production


