Comfortable with the Basics Series
The Three Types of Cryptocurrency Analysis: Fundamental, Technical and On-Chain Analysis


Learning about the fundamentals of cryptocurrency trading and investing may be one of the most valuable things you can do. As Su Zhu, the CEO of one of the largest crypto hedge funds, Three Arrows Capital, said, “If you don't understand crypto and refuse to learn, it's gonna be a tough century for you.”
We’re seeing more and more traders and investors applying these methods of analysis to the space. Bullish investment reports using fundamental analysis have been published by Goldman Sachs, JP Morgan and Morgan Stanley. And models built by on-chain analysts such as the Stock-to-Flow, have given bitcoin’s price a prediction of AU$1.9 million by 2025.
While many investors choose to ‘hodl’ their coins, the co-founder of Multicoin Capital, Tushar Jain, recognises that, “The crypto markets are the least efficient markets I’ve ever seen in my life, and that means active management has an opportunity to shine.”
With that in mind, let’s explore the three most popular types of cryptocurrency analysis; fundamental, technical and on-chain analysis. Let’s start with the fundamentals.
Contents
- Fundamental analysis for cryptocurrency
- Technical analysis for cryptocurrency
- On-chain analysis for cryptocurrency
- Combining all three methods of analysis for successful cryptocurrency trading
1. Fundamental analysis for cryptocurrency
Fundamental analysis takes a deep dive into all the information available about a cryptocurrency. It uses a mix of both quantitative financial metrics and qualitative measures. Ultimately, the aim of fundamental analysis is to determine a cryptocurrency’s intrinsic price.
When you then compare that fundamental value to the current market price, you can see whether the crypto asset is either undervalued or overvalued. An undervalued asset can represent a buying opportunity, while an overvalued asset can signal it’s time to take profits.\
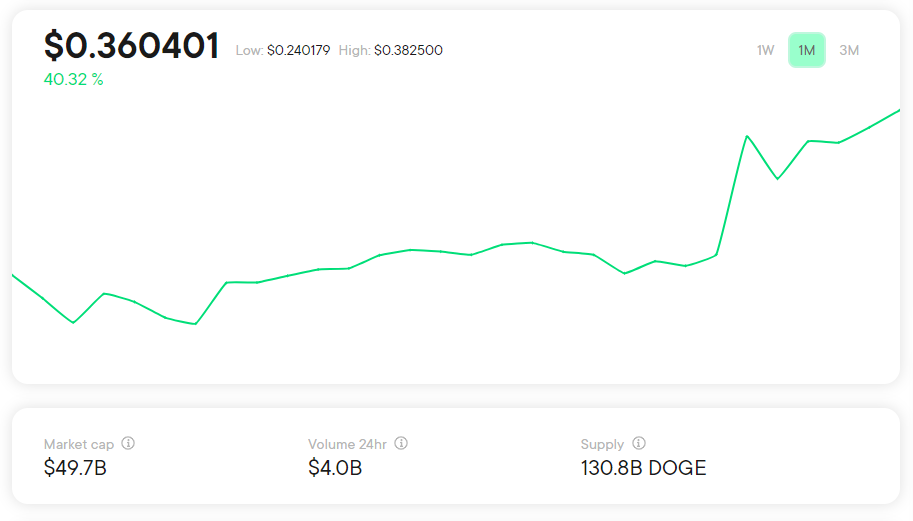
Consider a meme coin like Dogecoin, does it have any intrinsic value? The technology entrepreneur Mark Cuban doesn’t think so, saying “That’s not to say [dogecoin] has any intrinsic value. It doesn’t.”
However, when we apply the tools of fundamental analysis, we are more informed. So, what is Dogecoin? Firstly, we can see it lacks many fundamental value propositions like a roadmap, developer team, and even a whitepaper.
Still, it does have a market cap worth tens of billions, hundreds of millions in 24-hour volume, and is one of the most known of any cryptocurrency. It even proved a use case when Mark Cuban’s NBA team, the Dallas Mavericks, accepted it as a payment method for tickets. Clearly, it has an intrinsic value.
While the fundamental analysis may indicate that at $1 Dogecoin would be overvalued, at 5 cents it could be a great buy.
Key information to inform fundamental analysis:
- Market cap
- Volume
- Tokenomics
- Total value locked
- Roadmap
- Team members
- Community size and engagement
- Rate of network growth
- Rate of adoption
- Whitepaper
- Use case
2. Technical analysis for cryptocurrency
Technical analysis looks at past price movements in an attempt to determine which way the market is likely to move next. Is it going up? Down? Sideways? Technical analysis draws on a number of statistical indicators and patterns to determine the probability of each scenario. While traders use statistical metrics, they rely heavily on visual charts to help identify key signals, such as support and resistance. Ultimately, technical analysis is used to find buy and sell signals.
It’s important to note, traders using technical analysis never expect to be right all of the time. In fact, a trader that’s only correct 55% of the time can still be incredibly profitable. To manage risks for the times when the market moves contrary to what their indicators predicted, they use risk management practices, such as setting auto sells and investing only a portion of their holdings on a single trade.
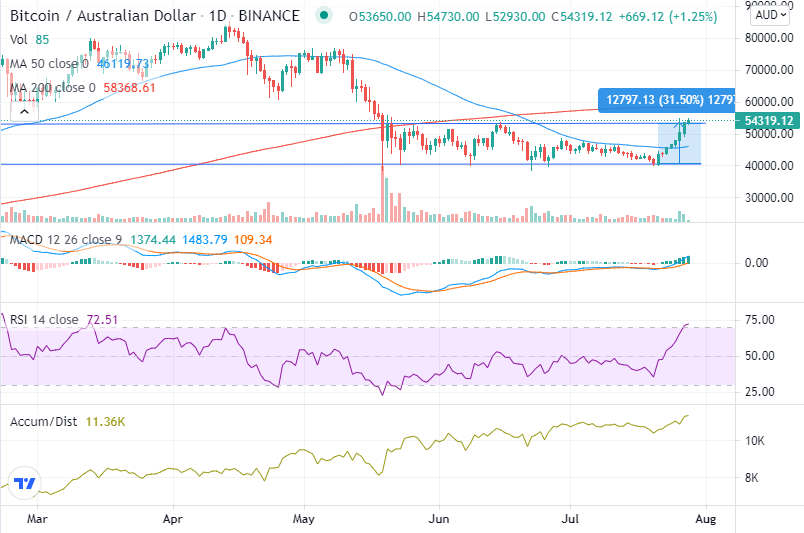
For example, consider the bitcoin chart above taken from TradingView in late July of 2021. The purple line in the lower third is the Relative Strength Index (RSI), which is an indicator that evaluates overbought or oversold conditions. In our market updates, Cointree’s Technical Trading Analysts identified that it was entering oversold territory and we may see some profit taking.
Next, our analyst noted the 50-day moving average was moving upwards, confirming what looked like a bullish trend. In summary, our analysts used technical trading tools to predict, that while we may see a short drop in price in the short term, the market would then most likely keep pushing higher. As you may remember, that’s exactly what happened.
Popular tools of fundamental analysis:
- Moving average convergence divergence (MACD)
- Relative Strength Index (RSI)
- Bitcoin price Simple Moving average (SMA)
- Moving Average (50,200) Crossover
- On-balance volume (OBV)
3. On-chain analysis for cryptocurrency
On-chain analysis looks at the public data on the blockchain. It’s an emerging field that’s unique to the cryptocurrency space, with traders using it to better predict market moves and gauge market sentiment. Ultimately, traders use on-chain analysis to identify the reasons different market participants are buying and selling, such as miners selling to pay their bills or hedge funds taking profits.
With on-chain analysis, traders look to see how different market participants are behaving, such as institutional investors, exchanges, miners and retail traders. They use a range of signals, including wallet balances, coin dormancy and transaction volume.
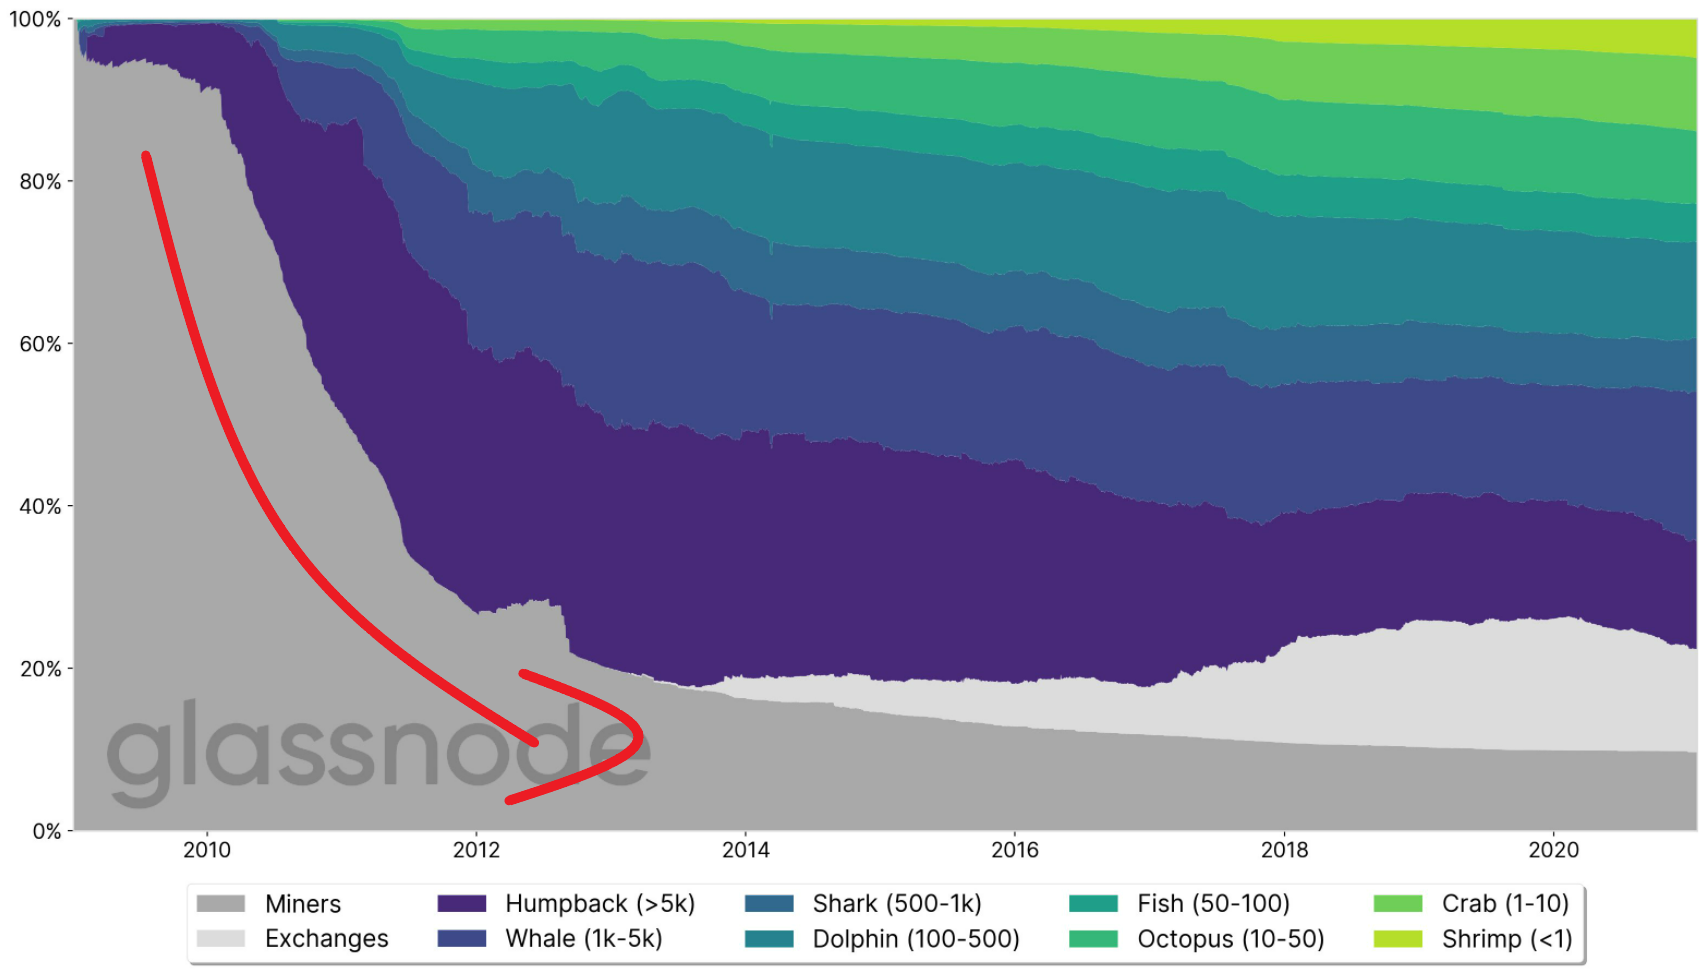
As we can see on the chart above from Glassnode, the percentage of bitcoins held by miners and large holders has decreased significantly, while the number of coins held by everyday investors has increased substantially. This is an important metric as it shows that the network continues to become more and more decentralised over time.
Moreover, the above chart can be used by traders to see how much influence that different market participants have over the price. As the co-founder and CTO of GlassNode, Rafael Schultzre-Kraft, reported, “We have seen a significant increase of bitcoin whales (and their supply) since 2020. This suggests that institutional investors, funds, family offices, and other [high net worth individuals] HNWI have been entering the space.”
Insightful on-chain indicators include :
- Number of active addresses
- Number of transactions
- On-chain volume
- Hash rate
- Miner revenue
- Total value locked (TVL)
- Market value to realised value (MVRV)
- Network value to transaction (NVT)
- Realised cap
Combining all three methods of analysis for successful cryptocurrency trading
While each of these methods of analysis is valuable on their own, they’re even more powerful when used together. Alone, a single metric may not be instructive. But like a thousand tiny brush strokes, combining all of your analysis methods can paint a compelling picture of the market.
Of course, you don’t need all three to align to make a trade. Maintaining your risk management practices and allocating appropriately lets you move in and out of a position as the market changes.
As we covered in our bitcoin success stories, the successful cryptocurrency hedge fund Three Arrows Capital mentioned in the intro were not always billionaire investors. They launched their fund from a kitchen table in their apartment using their own savings. Now, there’s multiple Lamborghinis sitting in front of their own trading office.
Having traded successfully for almost a decade, it’s clear that their fortune was built on careful analysis and skilled trading rather than luck. And tellingly, they’ve significantly outperformed the hodlers.

A leading crypto exchange helping Australians grow their wealth with the world of crypto. Founded in 2013, our Melbourne-based team has built an intuitive platform that’s easy to use, has low fees, and offers world-class security.


