
Market report for traders
Market Recap
China's crypto crackdown continues unabated.
The People’s Bank of China has told all major financial institutions to stop facilitating cryptocurrency transactions, while the mining ban intensified as the government cut power to 26 mines in the province of Sichuan.
The negative sentiments saw bitcoin, Ethereum, Dogecoin and the majority of altcoins drop more than 20% over the past week. Adding salt to the wound, the Dogecoin-branded NASCAR crashed into a wall at the speedway in Nashville. Although to keep this correction in perspective, bitcoin’s price is still up 336% since this time last year.
Who’s got diamond hands?
While the news has been negative, there’s evidence that long-term investors are following Warren Buffet's aphorism of “Be greedy when others are fearful.” For the first time since late October, Glassnode’s data shows that investors who've held bitcoin for more than six months have begun buying more than they’re selling, indicating that long-term investors are boosting their holdings. And we’ve seen how the price has risen since last October. Stock to flow model creator PlanB says his worst-case scenario for bitcoin is to hit $179K by the end of the year.
In the short term, bitcoin looks to either hold support at $30K and return towards $40K, or could drop further. And on a lighter note, the world-famous auction house Sotheby’s has announced it is welcoming diamond handed hodlers and will be accepting cryptocurrency bids for a massive 101-carat diamond worth US$15 million.
Technician's Take
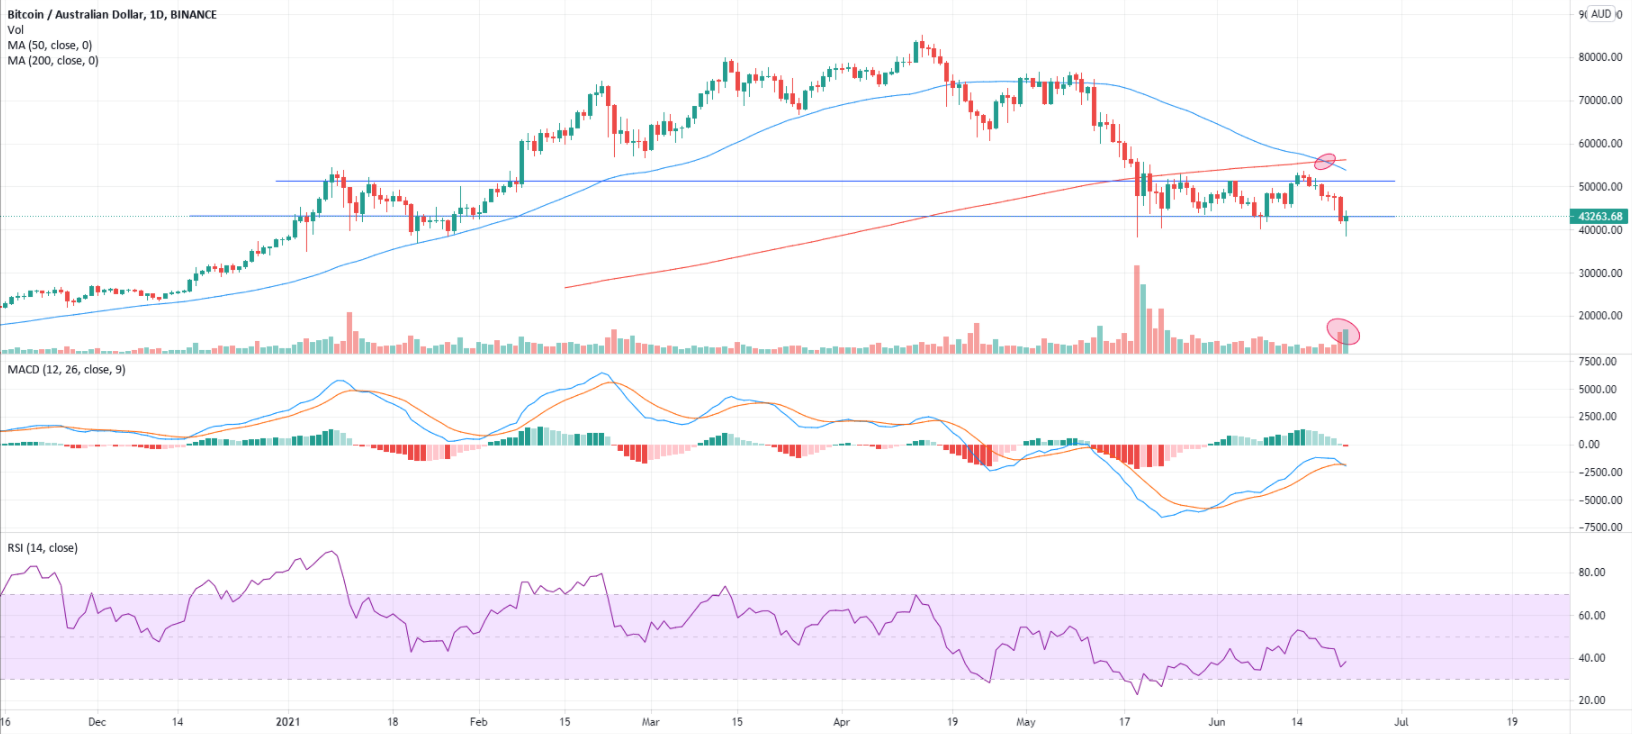
Strong sell pressure sees volume stepping up.
It has been a rather red week primarily fueled by a crackdown on mining by the Chinese and Iranian governments. From a technical point of view, you’ve probably heard people talk about the “death cross” and that it was a sign of doom and gloom for bitcoin (BTC), however it should be noted that while this is a traditional indicator it is also defined as a lagging indicator, where the average price for the last 50 days crosses over the average of the last 200 days. Given that these are the averages for the last ‘x’ periods it only reflects what we have already seen (past trend).
Trading volume has definitely increased and the buyers are slowly stepping up which is seeing BTC hold just below its recent support level and the positive takeaway is that both the selling pressure and subsequent price dip is still not at the same level as those seen a little over a month ago around the 19th of May.
MACD is crossing into bear territory, another bearish signal not helping the technical argument for a strong bullish reversal.
The RSI is starting to head towards oversold territory which could see buying coming in from a purely technical perspective.
So what is this trader looking for? Personally I will be looking for BTC to get itself back a little more firmly into its previous trading range, once established back in there we could see some decent entries present themselves for a trade or two. One note of caution, while it is always recommended that you have tight risk controls in place, times of volatility like we are experiencing now highlight the need for tight stops and proper risk management.
Beginner's Recap
- Strong sell pressure still sees BTC hold its range, just.
- The current week's low still hasn’t quite matched the low from earlier this month.
- Moving Average Convergence Divergence (MACD) is crossing into bear territory.
- There could be some great trading opportunities presenting themselves if this price holds.
Disclaimer: Information provided is for educational purposes and does not constitute financial product advice. You should obtain independent advice from an Australian financial services licensee before making any financial decisions.


